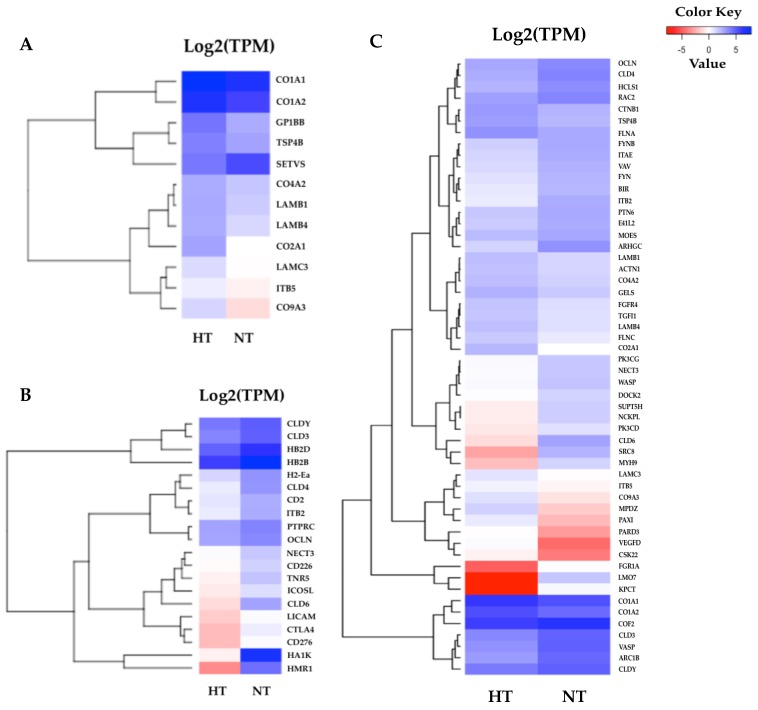
Figure 5.
Heatmaps of specific enriched pathways in the gill tissues. (A) Twelve DEGs of the extracellular matrix (ECM)–receptor interaction were highly expressed in the HT group and were divided into two major clusters. (B) Twenty DEGs of cell adhesion molecules (CAMs). (C) 54 DEGs were identified in the gill tissues, most of which were associated with cell junction and the adhesion pathway. The red indicates less expressed DEGs, and the blue indicates highly expressed DEGs when comparing the HT and NT groups.

