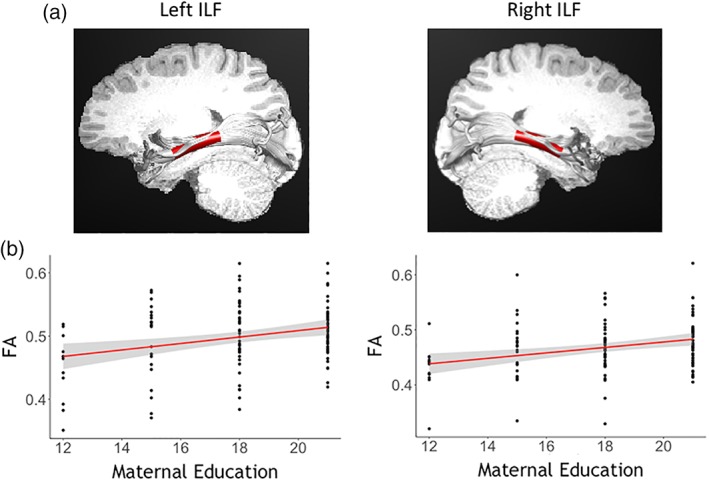
Figure 1.

Association between maternal education and fractional anisotropy in left and right ILF. (a) Tract profile of the left ILF depicting left and right ILF nodes that demonstrated significant association with maternal education (marked in red). (b) Scatter plots of FA and maternal education (BSMSS score). The representative node 11 is plotted for left ILF and node 23 for right ILF
