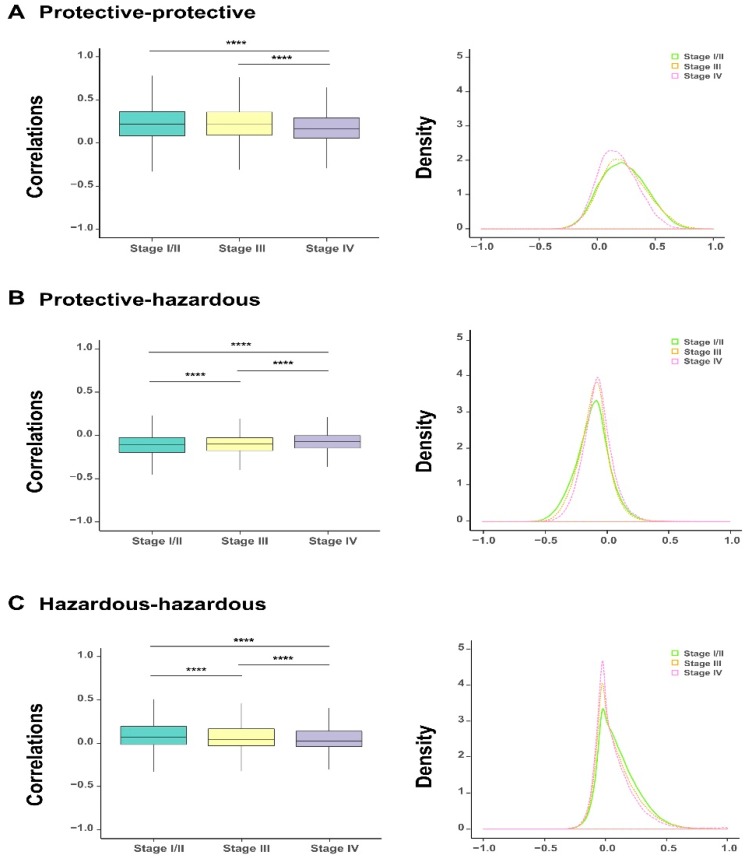
Figure 3.
The dynamic changes of correlations between the selected 1078 survival-related genes for bladder urothelial carcinoma (BLCA) patients at different cancer stages. The boxplots on the comparisons of correlation coefficients (all outliers are not shown) and the corresponding density curves between protective and protective genes, protective and hazardous genes, and hazardous and hazardous genes, respectively (A–C). * p-value < 0.05; ** p-value < 0.01; *** p-value < 0.001; **** p- value < 0.0001; two-sided Wilcoxon rank–sum test.

