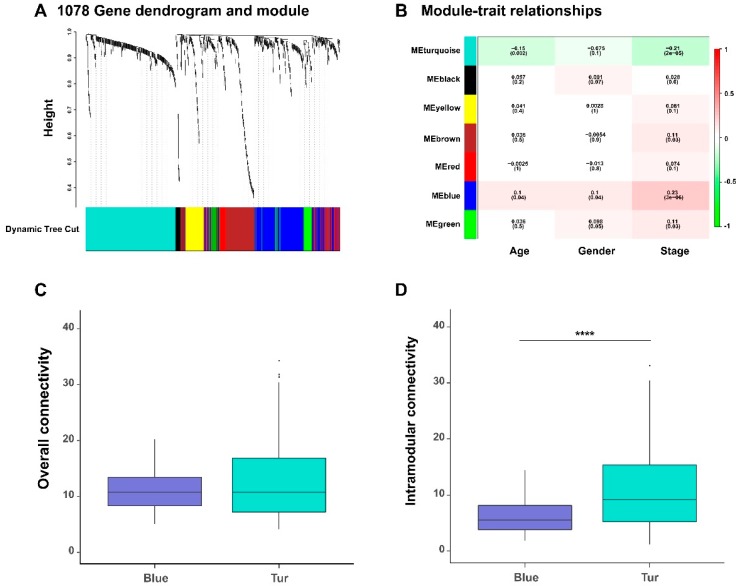
Figure 4.
The functional modules of the gene co-expression networks detected by the weighted correlation network analysis (WGCNA) algorithm. (A) The hierarchical clustering tree (i.e., dendrogram) based on the dissimilarity scores and the individual gene clusters resulting from the dynamic tree cut algorithm. (B) The relationships between the module eigengenes (rows), which are defined as the first principal components of the gene expression profiles within individual modules, and the clinical traits (columns) of all BLCA patients. Each box shows the correlation coefficient and the corresponding p-value (in the bracket). The colors on the left represent individual functional gene modules, corresponding to those identified in (A). The comparison of the overall connectivity (C) and the intramodular connectivity (D) of members in blue and turquoise modules. **** p-value < 0.0001; two-sided Wilcoxon rank–sum test.

