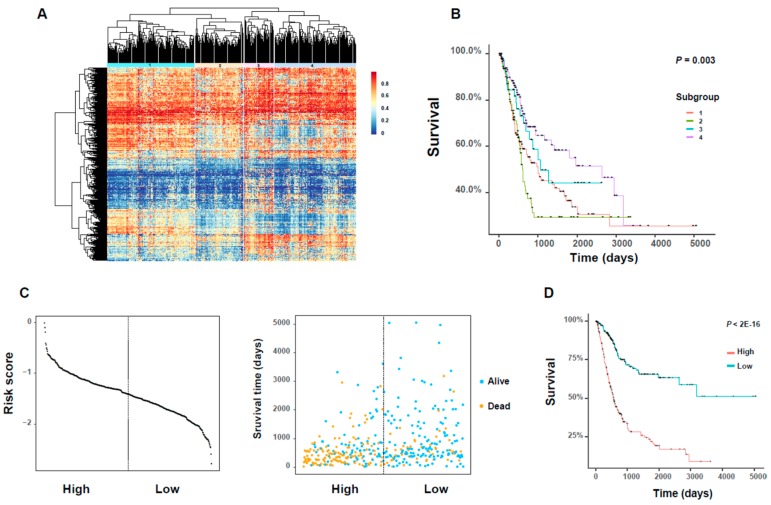
Figure 6.
The analysis of DNA methylation profiles related to clinical prognosis of BLCA patients. (A) The heatmap of hierarchy clustering based on the beta values of 340 active DNA methylation probes. The rows stand for the 340 probes and the columns stand for the 404 BLCA patients. (B) The Kaplan–Meier plot showing the difference in overall survival rates between individual subgroups. (C) The distribution of the 26 gene-based risk scores (which were defined based on the 26 selected DNA methylation probes) in high- and low-risk groups (left) and the corresponding clinical characteristics of patients (right). The dotted line shows the cutoff value of the risk score. (D) The Kaplan–Meier survival plot of the divided high- and low-risk groups and the statistical difference between two groups of patients which was detected by log–rank test.

