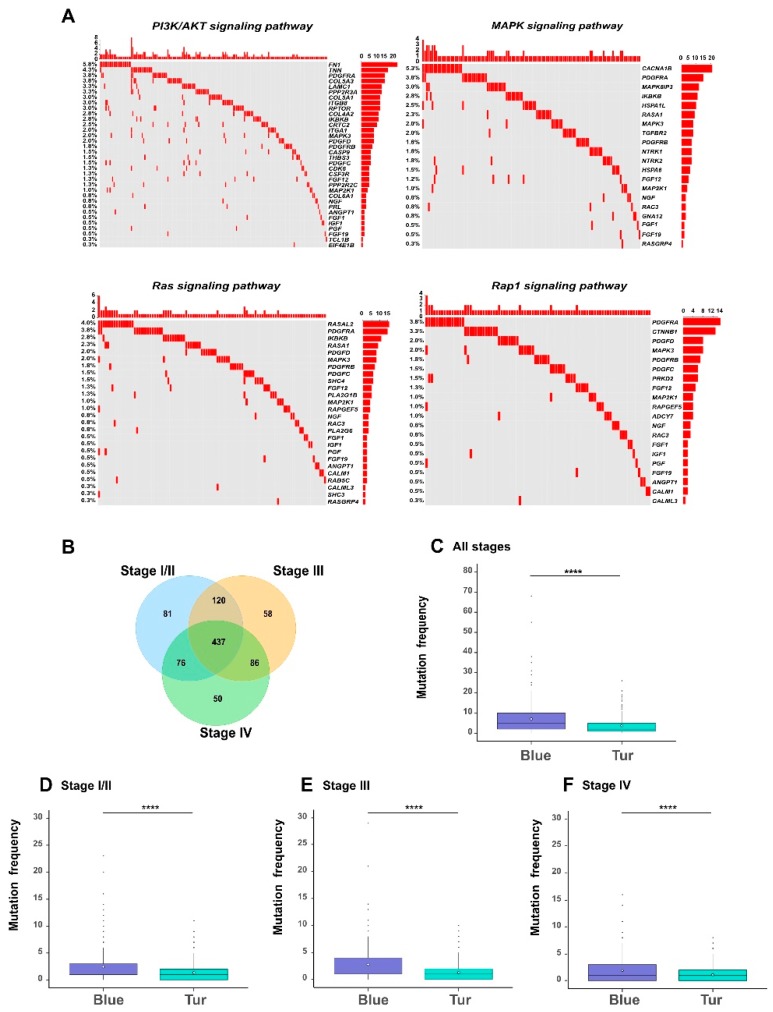
Figure 7.
The functional signatures of somatic mutations. (A) The oncoprints of four examples of cellular signaling pathways that were significantly enriched with the mutated genes in BLCA samples, including PI3K/AKT pathway, MAPK pathway, Ras pathway and Rap1 pathway. Rows represent the mutated genes, which were ranked according to the frequencies of mutated genes in all samples, and columns represent the involved samples. (B) A Venn diagram showing the overlap of mutated genes among different stages of bladder cancer. The comparisons of the frequencies of somatic mutations between blue and turquoise modules. The white diamonds represent the mean of mutation frequency (C–F). * p-value < 0.05; ** p-value < 0.01; *** p-value < 0.001; **** p-value < 0.0001; two-sided Student’s t-test.

