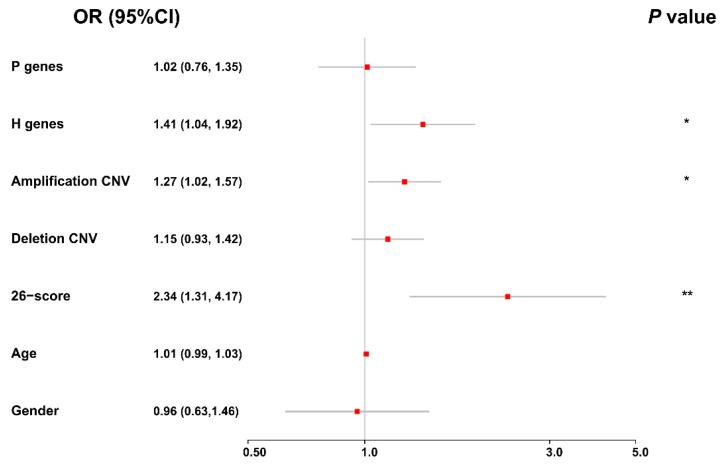
Figure 8.
The forest plot for the ordinal logistic regression result in the integrative analysis. The red box and grey line represent the odds ratio (OR) and the corresponding 95% confidence interval, respectively, and the asterisks mark the statistically significant variables. * p-value < 0.05; ** p-value < 0.01.

