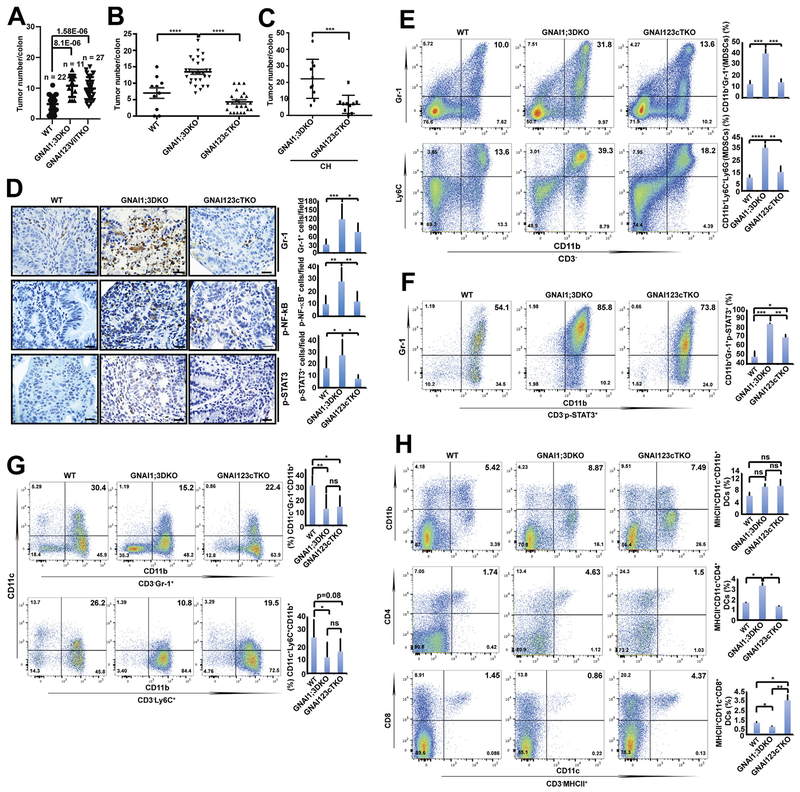
Figure 6.
Deletion of GNAI2 in CD11c+ cells, but not the epithelial cells, of GNAI1;3DKO mice diminishes colonic tumor multiplicity, CD4+ DC and MDSC expansion, and NF-ĸB and STAT3 activation but restores CD8+ DC and CD11c+ MDSC counts. (A) Tumor number/colon of AOM–DSS-challenged WT (n = 22), GNAI1;3DKO (n = 11), or GNAI123vilTKO (n = 27) mice on day 72. (B) Tumor number/colon of AOM–DSS-challenged mice (WT, n = 10; GNAI1;3DKO, n = 28; GNAI123cTKO, n = 23) on day 100. (C) Tumor number/colon of AOM–DSS-challenged mice (GNAI1;3DKO, n = 9; GNAI123cTKO, n = 10) under the CH condition for 87 days. (D) IHC analysis for Gr-1, p-NF-ĸBp65(S536), and p-STAT3(Y705) in colonic tissues from AOM–DSS-challenged WT, GNAI1;3DKO, and GNAI123cTKO mice (n = 3). Scale bars: 25 μm. (E) Representative FACS plots of splenic CD3−CD11b+Gr-1+ and CD3−CD11b+Ly6C+ MDSCs from indicated AOM–DSS-challenged WT, GNAI1;3DKO, and GNAI123cTKO at day 120. n = 4. (F) Representative FACS plots of splenic CD3−CD11b+Gr-1+p-STAT3+ MDSCs of AOM–DSS-challenged WT, GNAI1;3DKO, and GNAI123cTKO mice. (G) Representative FACS plots of splenic CD11c+ CD3−CD11b+Gr-1+ and CD11c+ CD3−CD11b+Ly6C+ MDSCs of AOM–DSS-treated WT, GNAI1;3DKO, and GNAI123cTKO mice. (H) Representative FACS plots of splenic CD11b+, CD4+, and CD8+ MHCII+CD11c+ DCs from AOM–DSS-challenged WT, GNAI1;3DKO, and GNAI123cTKO mice. n = 4. Quantitative analysis of MDSCs and DCs is shown next to the plots or images. All data are mean ± standard deviation (C–H) or standard error of the mean (A–B). *P < .05, **P < .01, ***P < .001, ****P < .0001. FACS, fluorescence-activated cell sorting; ns, not significant.

