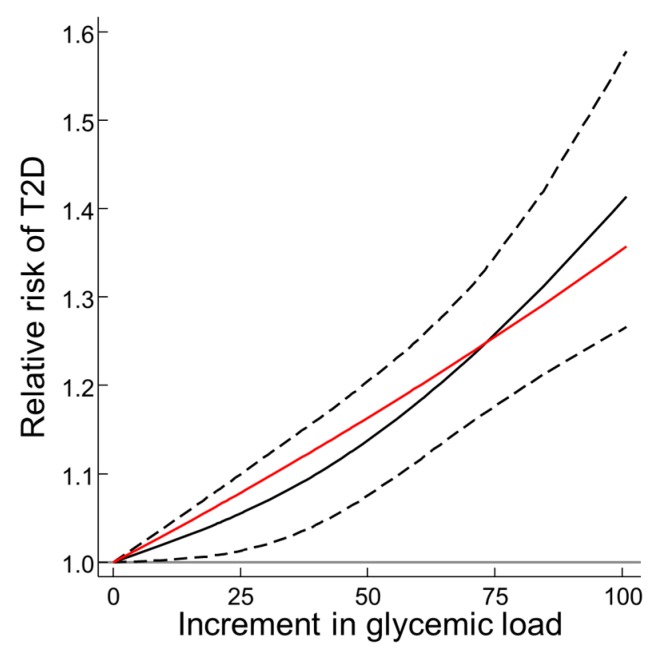
Figure 2.
Local dose-dependence of the relative risk of T2D on Glycemic Load in prospective cohort studies combined. Analysis was on the log RR and is shown exponentiated to RR. All studies had a validity correlation coefficient for their dietary instrument of > 0.55 for carbohydrate and reported by 3 or more quantiles. The slope (black continuous line) and 95% confidence intervals (dashed lines) derived from restricted (natural) cubic spline meta-regression (glst) with three knots at 0, 34 and 84 increments in GL (per 80 g/d in 2000 kcal (8400 kJ) diet). For comparison a log-linear dose response is also shown (red). There was no significant evidence for departure from log linearity (P > 0.194 for the secondary spline determinant). Thus the plots (red compared with black) overlapped. Observations were truncated at 100g GL/d in 2000 kcal due to scarcity of increments above this value. The log-linear dose-response T2D-GL risk relation increased by 27% per 80 g GL/d in 2000 kcal diet. RR was 1.27 (1.19–1.36) (P < 0.001, n = 13). The cubic spline curve reached 1.42 (1.27–1.59) for a 100 g increment. There were 44 incremental observations from 13 studies with CORR > 0.55. The mean GL at the intercept (zero increment in GL) was 105 g/d in 2000 kcal (8400 kJ) based on the glucose (GI = 100) scale. Studies were from: Hodge et al. 2004 [39], Hopping et al. 2010 (5 studies, fCA, mCA, fJA, mJA, mNH) [44], Mekary et al. 2011 [30], Sahyoun et al. 2008 [45], Salmeron et al. 1997 in men [31], Sakurai et al. 2012 [41], Schulze et al. 2004 [33], van Woudenbergh et al. 2011 [42] and Villegas et al. 2007 [34]. Abbreviations: GL, glycemic load; RR, relative risk; T2D, type 2 diabetes.

