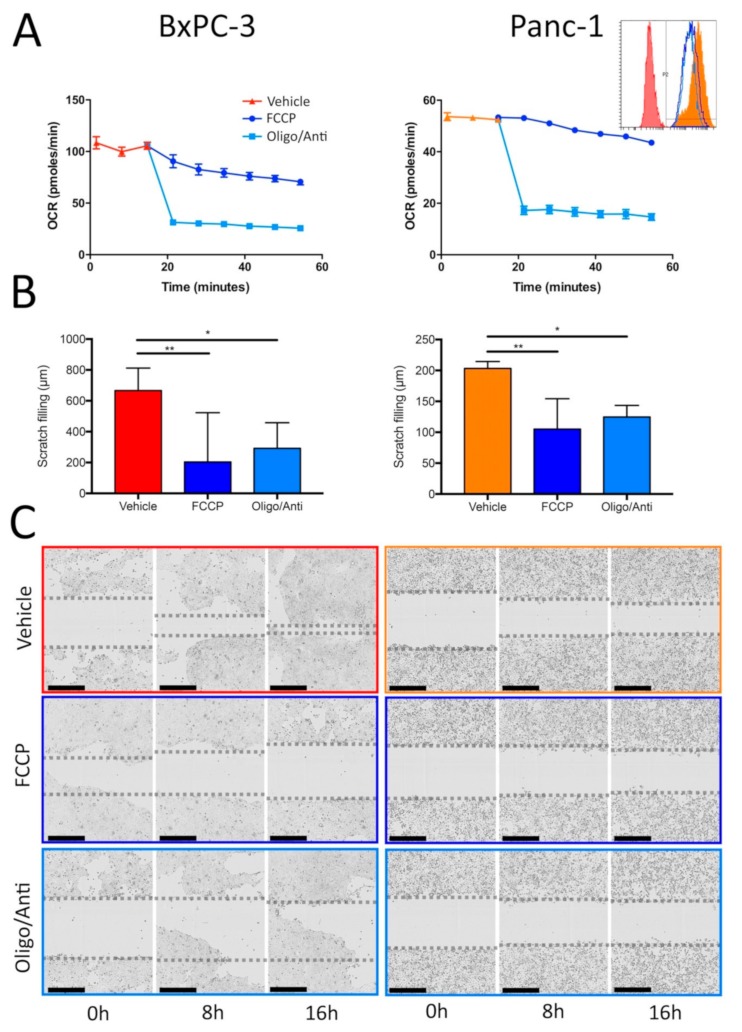
Figure 2.
Migration is dependent on oxidative phosphorylation (OXPHOS) in high myoferlin expressing pancreatic ductal adenocarcinoma (PDAC) cell lines. (A) Kinetic oxygen consumption rate (OCR) in BxPC-3 and Panc-1 cells before and after treatment with 10 µM FCCP or 10 µM oligomycin (Oligo) + 1 µM antimycin A (Anti). Panc-1 inset represents mitochondrial membrane potential measurement by tetramethylrhodamine, ethyl ester (TMRE) fluorescence in the same conditions. (B) End point (16 h) of two-dimension migration kinetic assay (scratch assay) of BxPC-3 and Panc-1 cell lines after treatment with 10 µM FCCP or 10 µM oligomycin (Oligo) + 1 µM antimycin A (Anti). (C) Representative images of two-dimension migration kinetic assay with BxPC-3 and Panc-1 after treatment with FCCP 10 µM or 10 µM oligomycin (Oligo) + 1 µM antimycin A (Anti). One representative experiment out of three is illustrated. Each data point represents mean ± SD, n = 3. ** P < 0.01, * P < 0.05.

