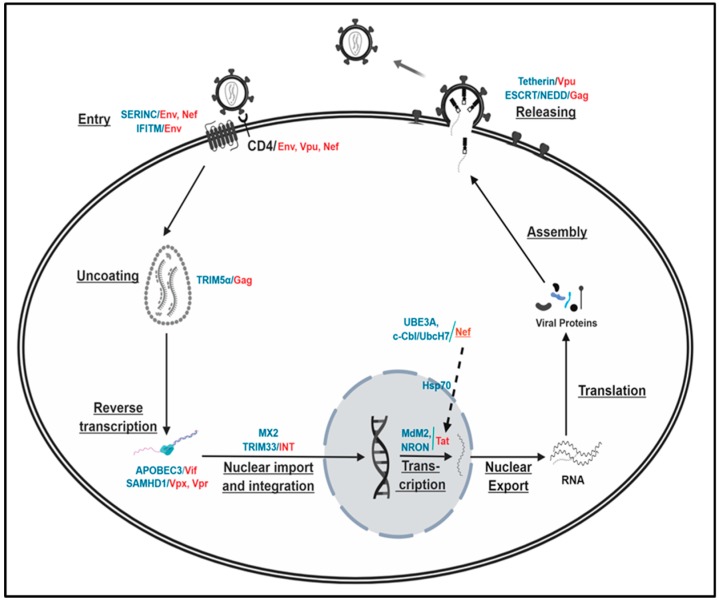
Figure 1.
Schematic representation of the HIV-1 life cycle. Each step of the HIV-1 life cycle is underlined, and the viral and cellular proteins involved in each step of the proteasomal regulation are shown as red and teal, respectively. Proteasomal regulation between viral proteins is depicted as a dotted line. See the text for the detailed description of the role of the indicated viral and cellular proteins for the proteasomal degradation processes.

