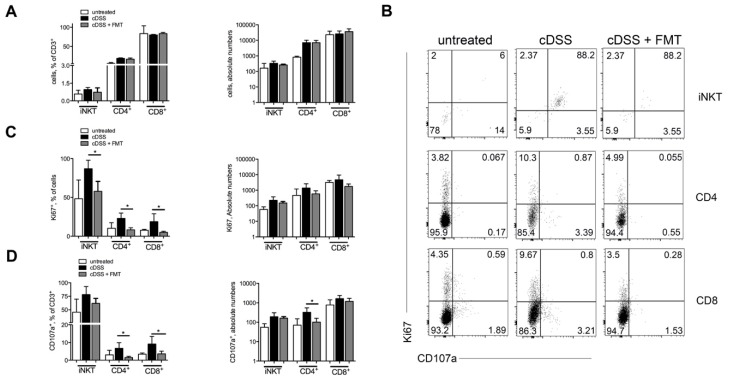
Figure 3.
Therapeutic FMT modulates T cell phenotypes. (A) Frequencies and absolute numbers of colonic CD4+ T, CD8+ T cells, and Invariant Natural Killer T (iNKT) cells in untreated (white bars), chronic-DSS-treated (black bars), and FMT-treated (grey bars) mice 63 days after starting DSS administration. (B) Representative dot plots and (C,D) frequencies and absolute numbers of Ki67+ (C) and CD107a+ (D) colonic CD4+, CD8+ T cells, and iNKT cells in untreated (white bars), DSS-treated (black bars), and FMT-treated (grey bars) mice in the chronic setting. Significance was determined using unpaired Mann-Whitney test and expressed as mean ± SEM. p < 0.05 (*), p < 0.01 (**), p < 0.001 (***) were regarded as statistically significant. Total untreated n = 8, cDSS-treated n = 10, cDSS + FMT n = 10 in 2 independent experiments. Outliers were detected with Grubb’s test.

