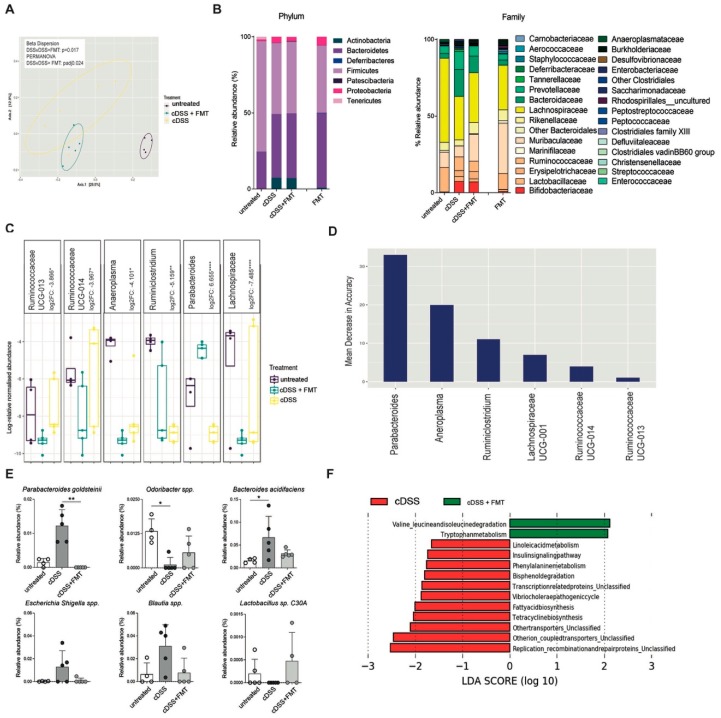
Figure 6.
Gut microbiota analysis upon Faecal Microbiota Transplantation (FMT) in the chronic colitis model. (A) Microbiome clustering based on Principal Coordinate Analysis (PCoA) of unweighted UniFrac distances of fecal gut microbiota derived from untreated (violet dots), cDSS- (blue dots), and cDSS + FMT (yellow dots)-treated mice. Significant differences in beta-diversity between cDSS and cDSS + FMT groups were determined by beta-dispersion and Permutational Multivariate analysis of variance (PERMANOVA) with p-value correction by Bonferonni (padj), with p < 0.05 as cut-off for significance. (B) Bar plots showing taxonomic composition in untreated, cDSS, and DSS + FMT groups, including only taxa with relative abundance >1%, at phylum (left panel) and family (right panel) level. (C) Log-relative normalised abundances in untreated (violet boxes), cDSS- (blue boxes), and cDSS + FMT (yellow boxes)-treated mice of genera found to be differentially abundant in cDSS and cDSS + FMT mice, as determined by DESeq2. Log2 fold change (log2FC) relative to cDSS group is reported for each genus. Negative log2FC indicates decreased abundance in cDSS compared to cDSS + FMT, whereas positive log2FC indicates increased abundance in cDSS compared to cDSS + FMT. Significant differences in log2FC were determined by Wald test with p-value correction by Benjamin and Hochberg. p < 0.05 (*), p < 0.01 (**), p < 0.001 (***), p < 0.0001 (****) were regarded as statistically significant. (D) Ranking of differentially abundant taxa in cDSS and cDSS + FMT mice by importance to microbial community, as determined by their Mean Decrease in Accuracy (MDA) using a Random Forest classifier. Higher MDA means greater importance. (E) Relative abundances of bacterial species in untreated (white bars), cDSS (dark grey bars), and cDSS + FMT (light grey) treated mice. (F) Predicted metabolic attributes between cDSS and cDSS + FMT groups. Sequences were used to predict functions against the Kyoto Encyclopedia of Genes and Genomes (KEGG) database, which is implemented in Phylogenetic Investigation of Communities by Reconstruction of Unobserved States (PICRUSt) software package.

