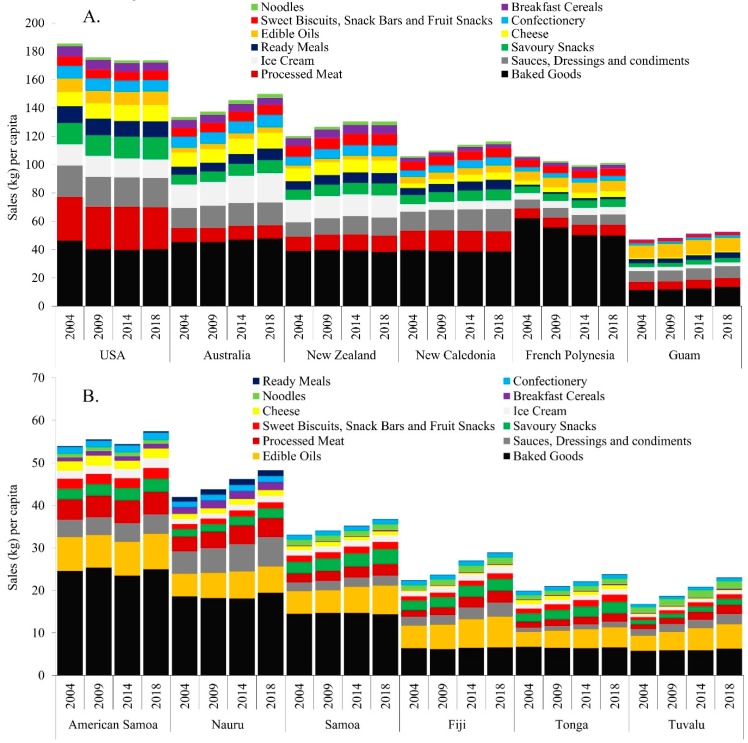
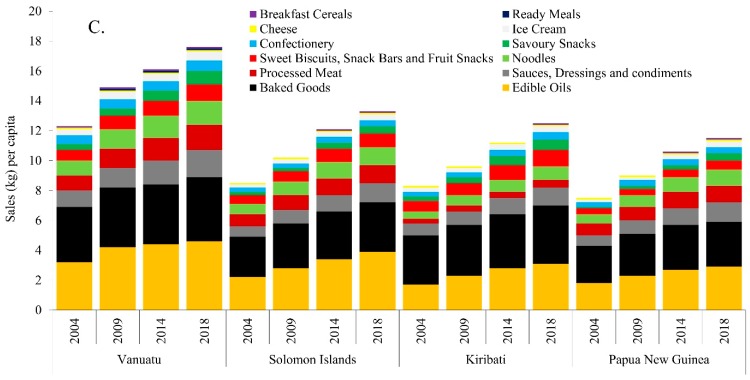
Figure 1.
Per capita processed food sales in (A) high-income, (B) upper-middle income and (C) lower-middle income Pacific island countries, 2004–2018. Note: Different scales are used for each graph to demonstrate granularity in product categories; categories are ranked from highest (bottom) to lowest (top) volume and align with the same product category order in the figure keys.


