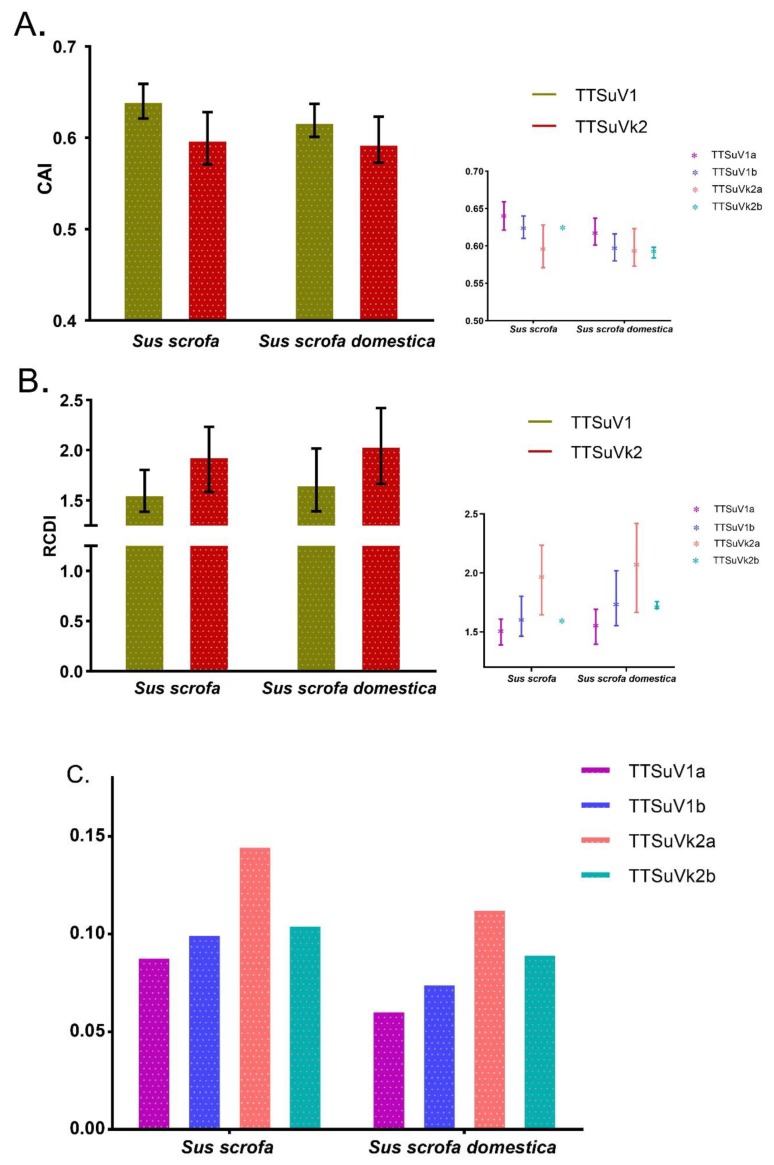
Figure 5.
Codon adaptation index (CAI) (A), relative codon deoptimization index (RCDI) (B), and similarity index (SiD) (C) analysis of TTSuV. TTSuV1 is represented in green-brown and TTSuVk2 is represented in red, while TTSuV1a, TTSuV1b, TTSuVk2a, and TTSuVk2b are represented in purple, blue, pink and green, respectively.

