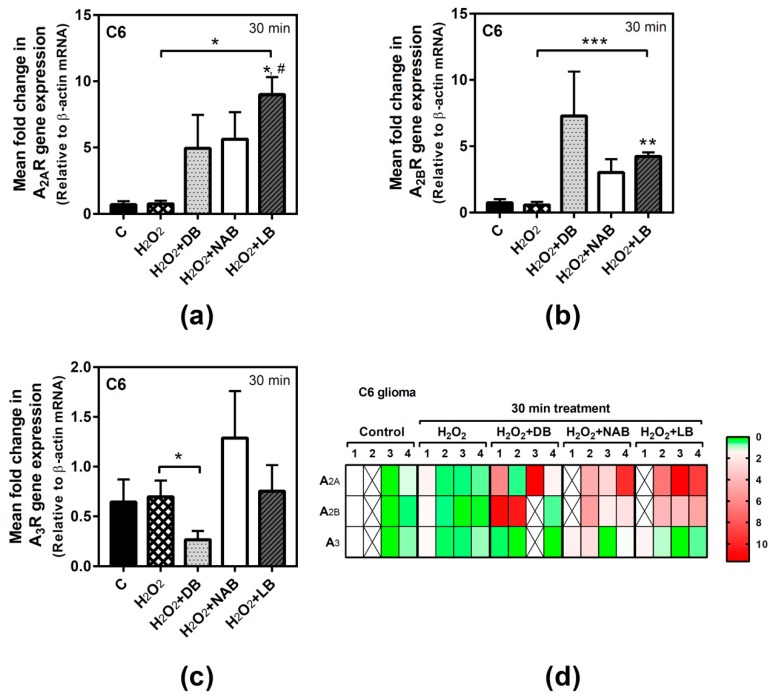
Figure 6.
Adenosine receptors gene expression assayed by quantitative real-time RT-PCR in C6 cells. After total RNA isolation, A2A (panel a), A2B (panel b), and A3 (panel c) receptor gene expression levels were detected by TaqMan universal PCR following the protocol indicated in “Materials and Methods”. β-actin was used as an endogenous control in all assays. Treatments were performed for 30 min with 50 µM hydrogen peroxide (H2O2) and DB, NAB, and LB extracts in C6 cells. (d) Heatmap of gene expression levels obtained in the analyzed samples. Data are means ± SEM of, at least, three independent assays; * p < 0.05, ** p < 0.01, and *** p < 0.001, significantly different from their corresponding control (C) or considered bars according to Student’s t test; # p < 0.05 significantly different from control (C) according to one-way ANOVA test.

