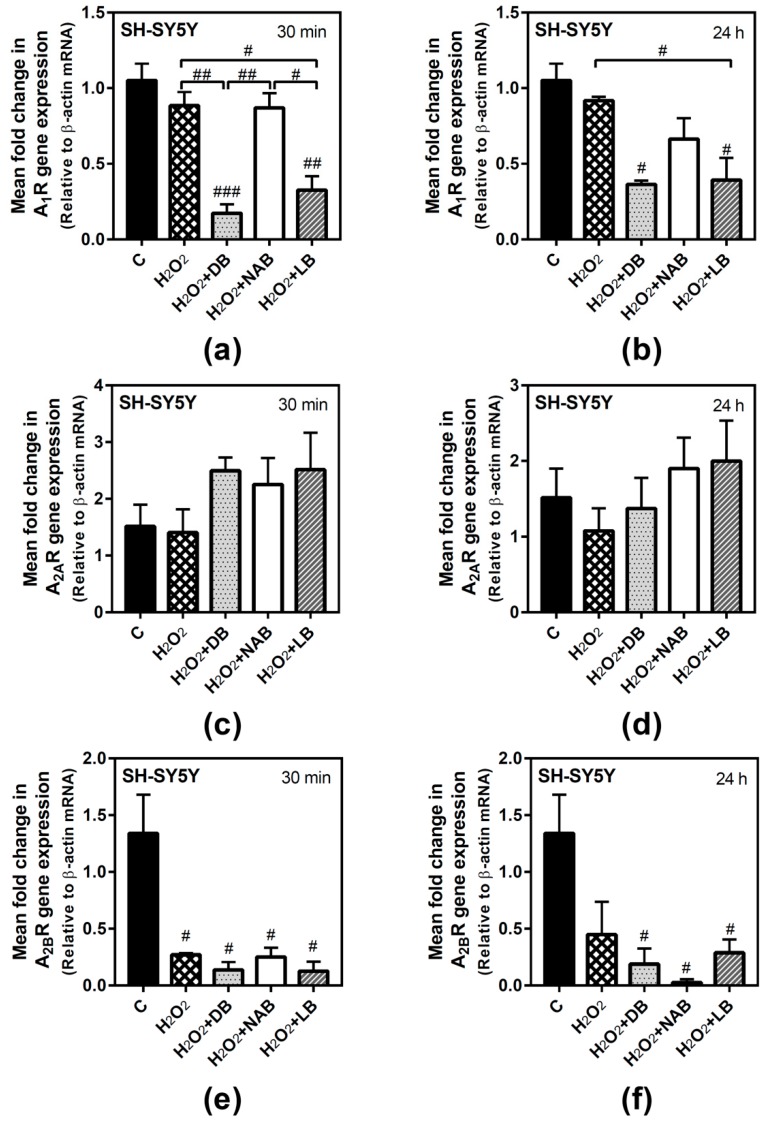
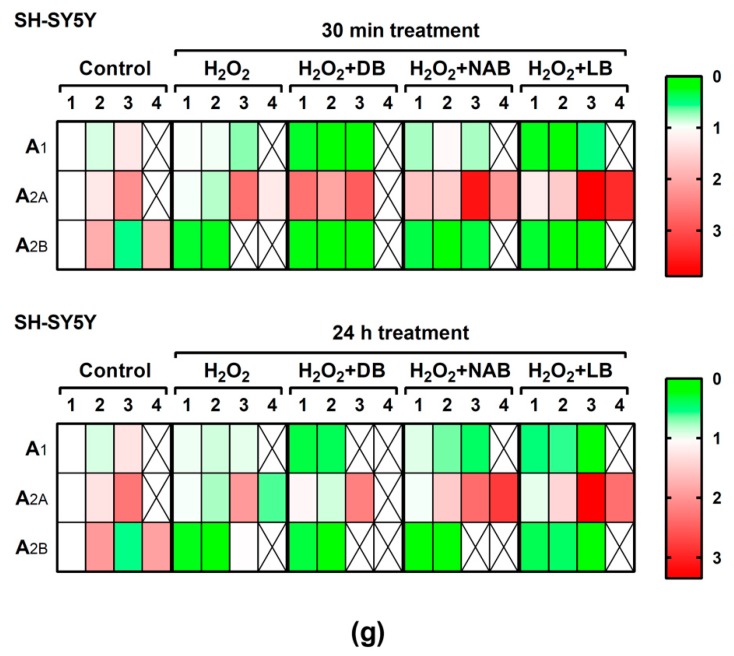
Figure 7.
Adenosine receptors gene expression assayed by quantitative real-time RT-PCR in SH-SY5Y cells. After total RNA isolation, A1 (panels a and b), A2A (panels c and d), and A2B (panels e and f) gene expression levels were detected by TaqMan universal PCR following the protocol indicated in “Materials and Methods”. β-actin was used as an endogenous control in all assays. Treatments were performed for 30 min (a, c, e) and 24 h (b, d, f) with 50 µM hydrogen peroxide (H2O2) and DB, NAB, and LB extracts in SH-SY5Y cells. (g) Heatmap of gene expression levels obtained in the analyzed samples. Data are means ± SEM of, at least, three independent assays; # p < 0.05, ## p < 0.01, and ### p < 0.001, significantly different from control (C) or considered bars according to one-way ANOVA test.


