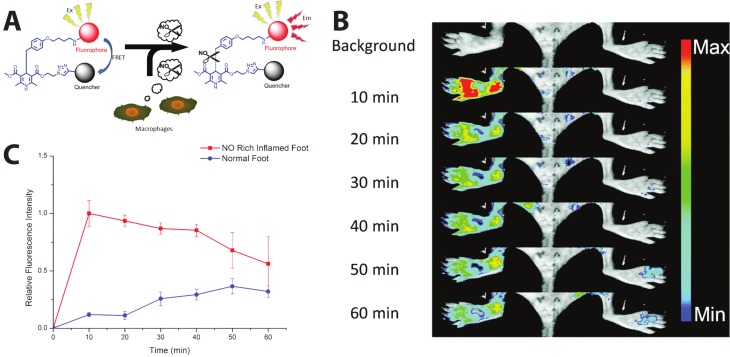
Figure 6.
In vivo monitoring of inflammation-associated NO concentration. (A) Schematic of NO sensor. (B) Left foot treated with Freund’s adjuvant to induce inflammation; right foot is the inflammation-free control. (C) Comparison of the relative fluorescent intensity in the NO-rich inflamed foot and normal foot after intravenous injection of the probe. An 8-fold higher fluorescence intensity was observed in the inflamed area compared to the control area within 10 min post injection. Fluorescence signals were collected at 600 nm after 470 nm excitation. Reprinted from [114]. Distributed under a Creative Commons Attribution 3.0 Unported License (CC BY 3.0).

