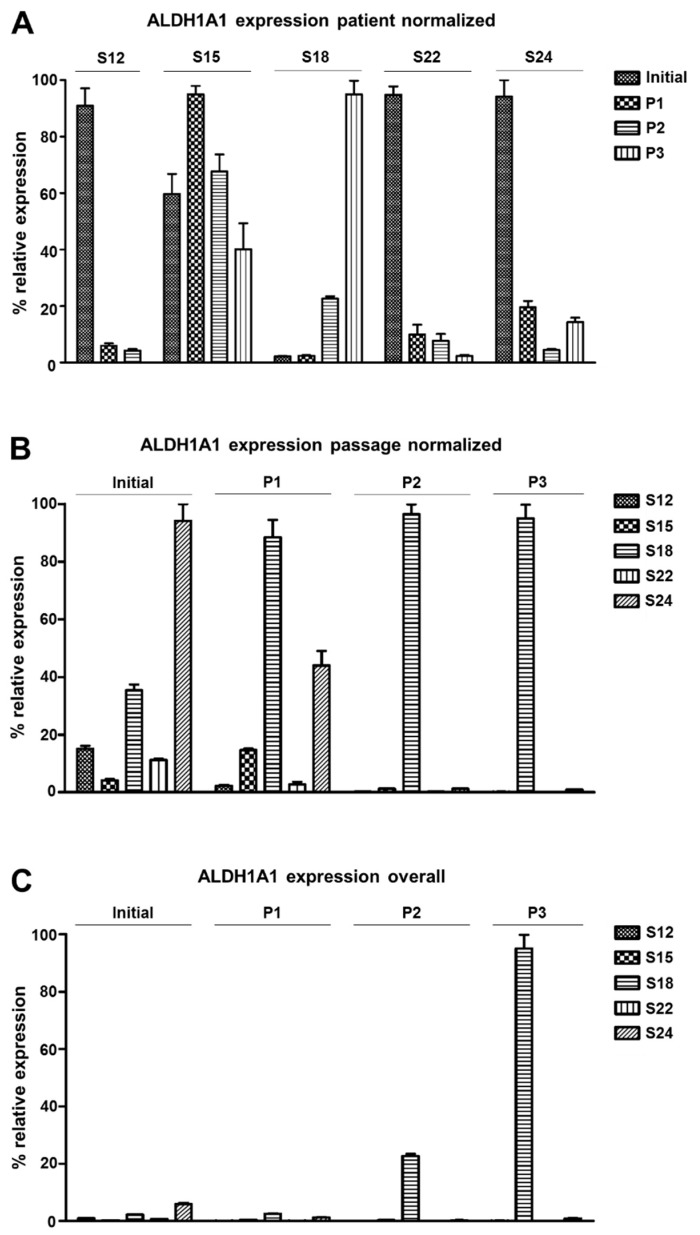
Figure 5.
ALDH1A1 expression in primary HNSCC cell cultures in the initial tumor tissue and within the first three culture passages. (A) Relative expression (%) normalized by patient to compare ALDH1A1 levels relative to other cell entities of the same patient sample show higher ALDH1A1 levels in S18 cultures than in the initial S18 tumor. All other cultures showed lower or similar ALDH1A1 expression in comparison to the original tumor tissue. (B) Passage normalized data to compare ALDH1A1 levels between distinct patient samples within each passage and the initial tumors. Tumor sample S24 shows highest ALDH1A1 expression, whereas in cell culture cells of S18 overtop S24 cells form passage 1 on. (C) Data normalized to compare all samples of all passages and the initial tumor to each other reveals stark gradual enrichment of ALDH1A1 expressing cells in S18 cultures; P1 = passage 1; initial = original tumor tissue.

