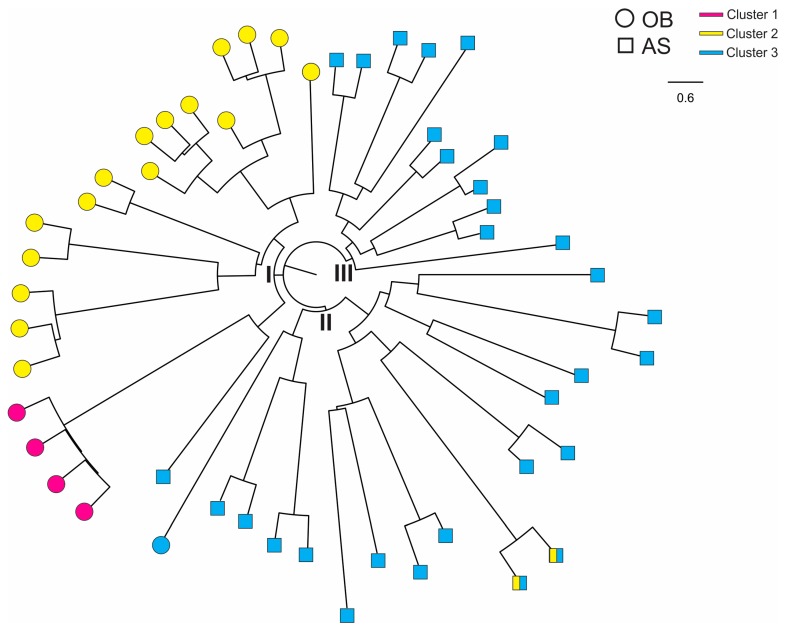
Figure 6.
Neighbor-joining tree showing genetic relatedness among the P. falciparum isolates. OB, Obom (as circles) and AS, Asutsuare (as squares). Color (pink, yellow and blue) denoted the corresponding cluster for each sample (Figure 4). Samples from OB were found in clade I and samples from AS in clades II and III.

