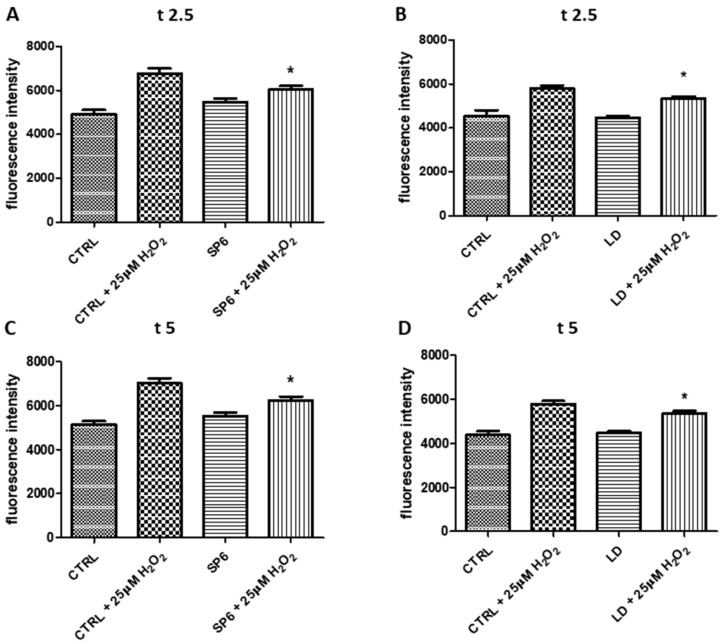
Figure 5.
Measurement of the intracellular reactive oxygen species (ROS). The differentiated SY-SH5Y cells incubated with 1 µM SP6 (panels A and C) or LD (panels B and D) for 24 h, were treated with 25 µM H2O2 for 5 min. Figure 7 reported the fluorescence intensities at two points (t2.5 and t5) during the assays. The means ± SEM derived from two different experiments (each with n = 8; * 0.001 < p < 0.05; n.s., p > 0.05).

