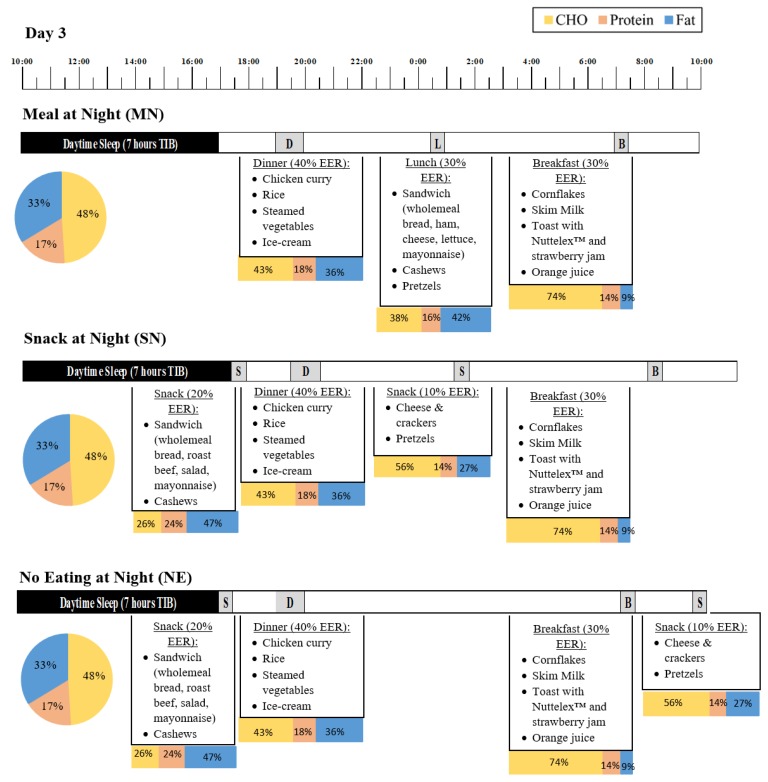
Figure 2.
Example meal plan for day 3 of the simulated shiftwork protocol for a participant with an EER of 9500 kJ. The upper panel shows the Meal at Night condition (MN), the middle panel shows the Snack at night condition (SN) and the lower panel shows the No Eating at Night condition (NE). The pie chart represents the proportion of carbohydrates (CHO; yellow), protein (orange), and fat (blue) for the total 24 h period of NS3, and the stacked bars indicate the proportion of carbohydrate, protein, and fat for each meal and snack within the 24 h period of nightshift 3. Values may not total 100% due to small contributions from fibre. There were some variations between conditions in the foods provided, however 24 h macronutrient intake was matched.

