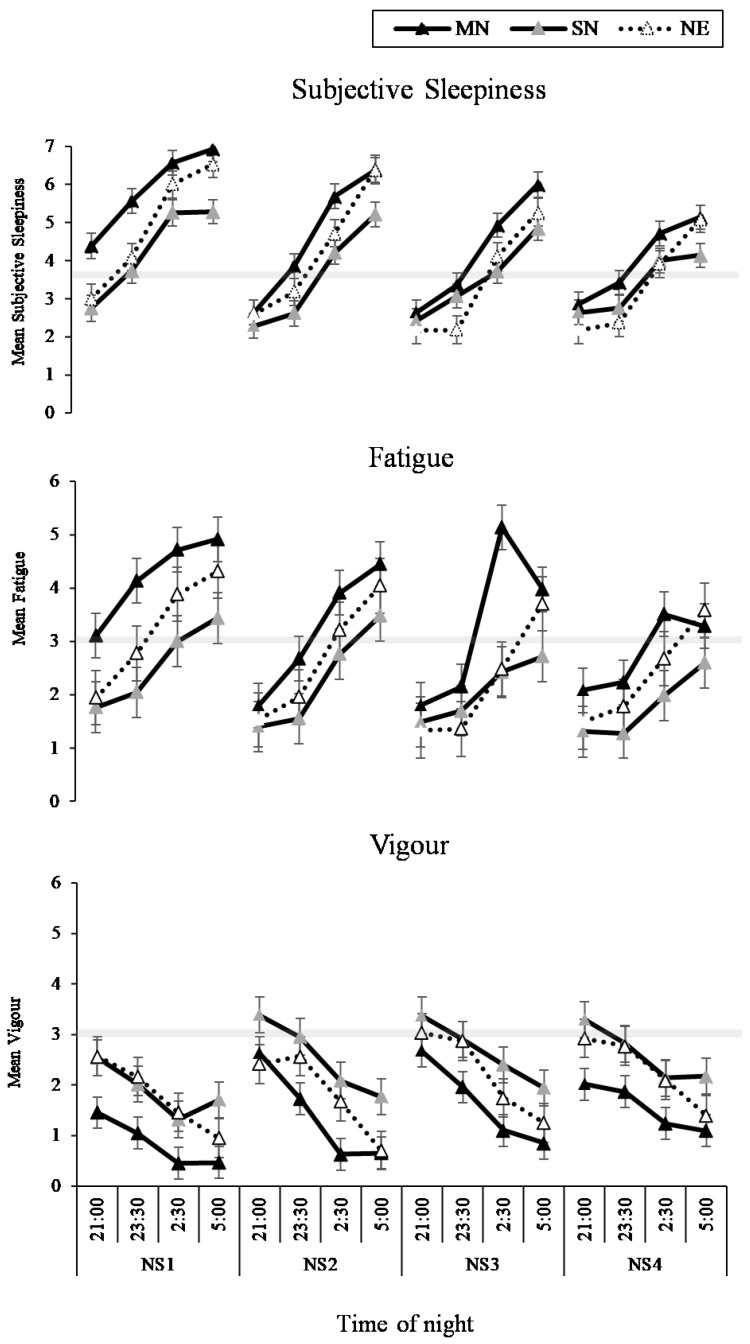
Figure 9.
Sleep and fatigue results from the interaction effect between eating condition by time of night by nightshift (NS1-4) for sleepiness, fatigue and vigour. Black lines with black markers represent the Meal at Night condition (MN), black lines with grey markers represent the Snack at Night condition (SN), dashed lines with white markers indicate the No Eating at Night condition (NE). The grey shaded horizontal line on each line graph indicates the midpoint of each VAS. Means presented are estimated marginal means, and error bars indicate standard errors from model estimates.

