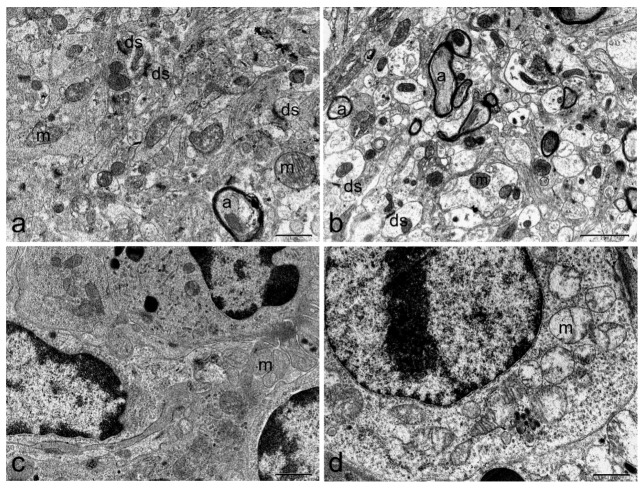
Figure 5.
Representative electron micrograph showing ultrastructure of brain (a,b) and spleen (c,d) of control mice (first column) or mice treated with 500 µg/kg bw TTX (second column). Swollen mitochondria were detected in spleen cells. (a,c,d) scale bar = 1 µm, (b) scale bar = 2 µm. Axon (a), dendritic synapse (ds), mitochondria (m).

