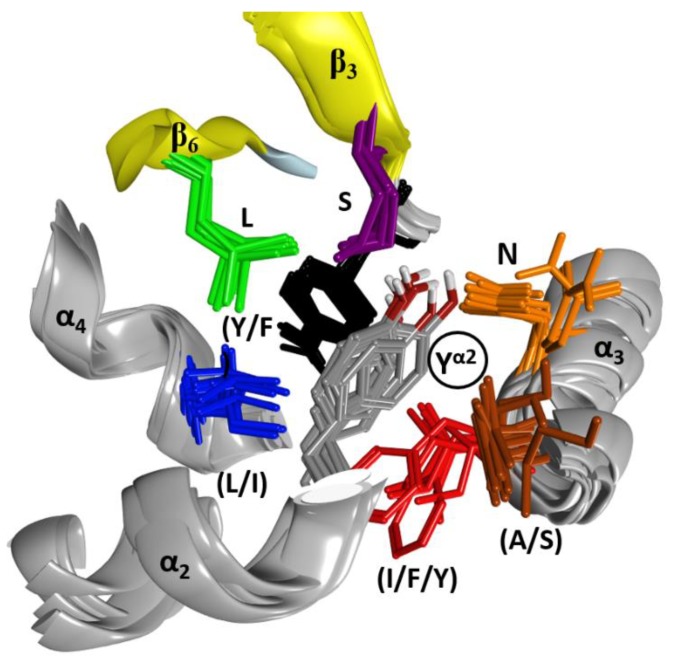
Figure 5.
Interactions in ClusterI of the α2–α4 superstructure. The cluster of residues around the conserved Tyrα2 (circled label; grey residue) is shown in this set of six overlaid C3 structures. The side- chains are shown for Tyr/Pheβ2,3 (black), Serβ3 (mauve), Leuβ6 (green), Leu/Ileα4 (blue), Ile/Phe/Tyrα3 (red), Ala/Serα3 (brown), and Asnα3 (orange).

