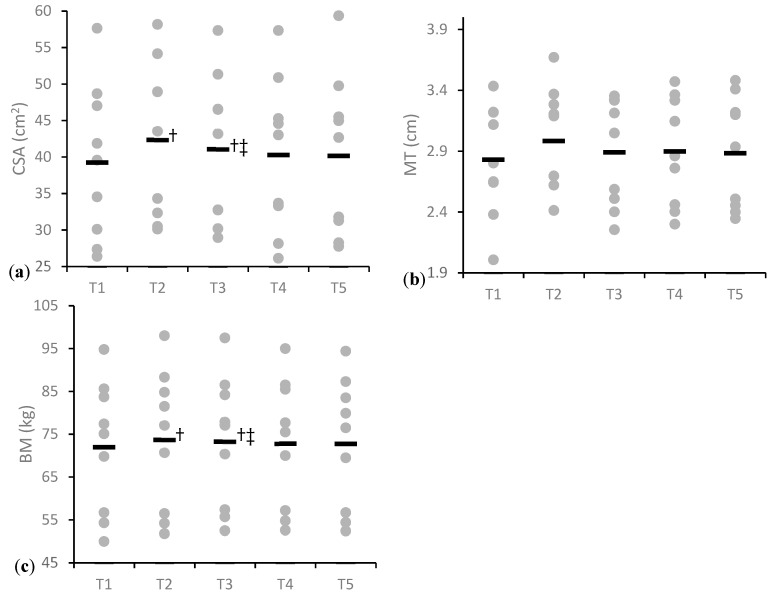
Figure 5.
Muscle size and body mass throughout each time point. (a) Cross-sectional area; (b) Muscle thickness; (c) Body mass. Gray dots represent individual subjects and black line represents the group mean. † Significantly different from the previous timepoint (p ≤ 0.05). ‡ Significantly different from T1 (p ≤ 0.05).

