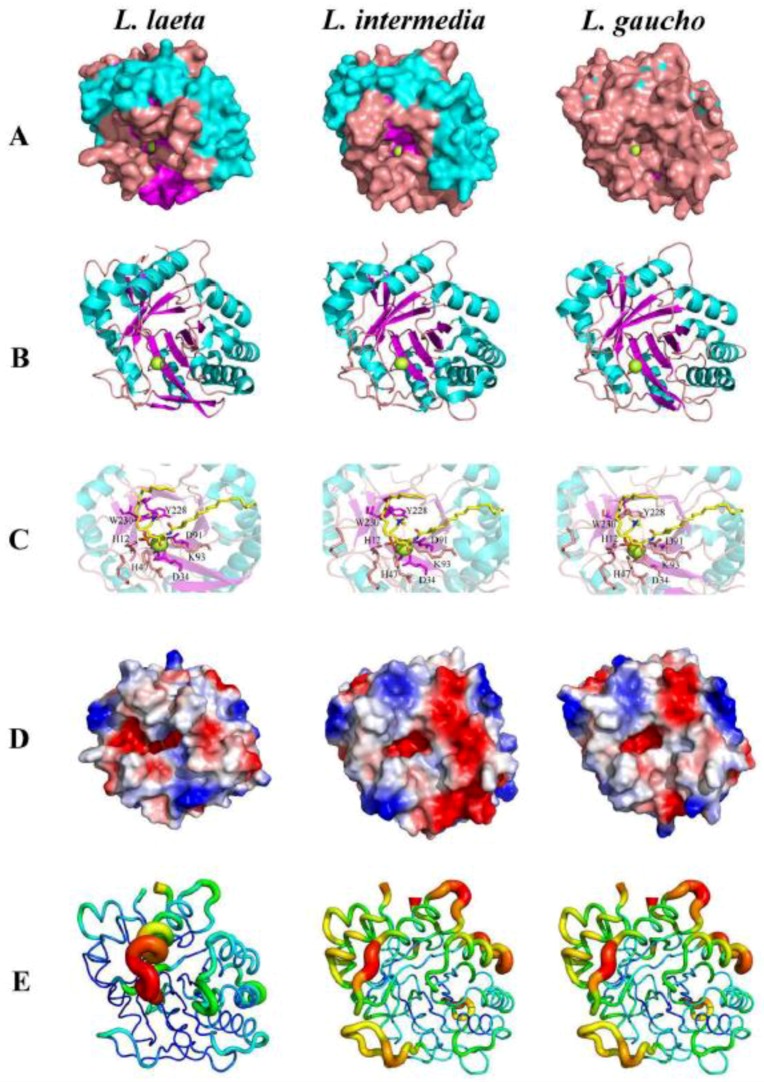
Figure 3.
Structural comparison of venom phospholipase-D from Loxosceles gaucho, Loxosceles intermedia and Loxosceles laeta. (A) Surface view and (B) Ribbon view showing regions of α-helix (cyan), β-Sheet (magenta), Loop (salmon) and Magnesium ion (green sphere). (C) Zoom view of the catalytic site showing conserved amino acid residues (H12, H47, E32, D34, K93, Y228 and W230), Magnesium ion (green sphere), and the sphingomyelin (yellow stick). (D) Electrostatic surface colored by charge, from red (-2 kV) to blue (+2 kV). (E) Flexibility representation generated by b-factor putty, from more rigid regions in blue and green to more flexible regions yellow and red. Models are generated according to PDB codes: 1XX1 (Loxosceles laeta) and 3RLH (Loxosceles intermedia). Model for Loxosceles gaucho was generated using Modeller Program with the LgRec1 sequence from GenBank code: JX866729. PyMOL originated in all figures.

