
Fig. 2.
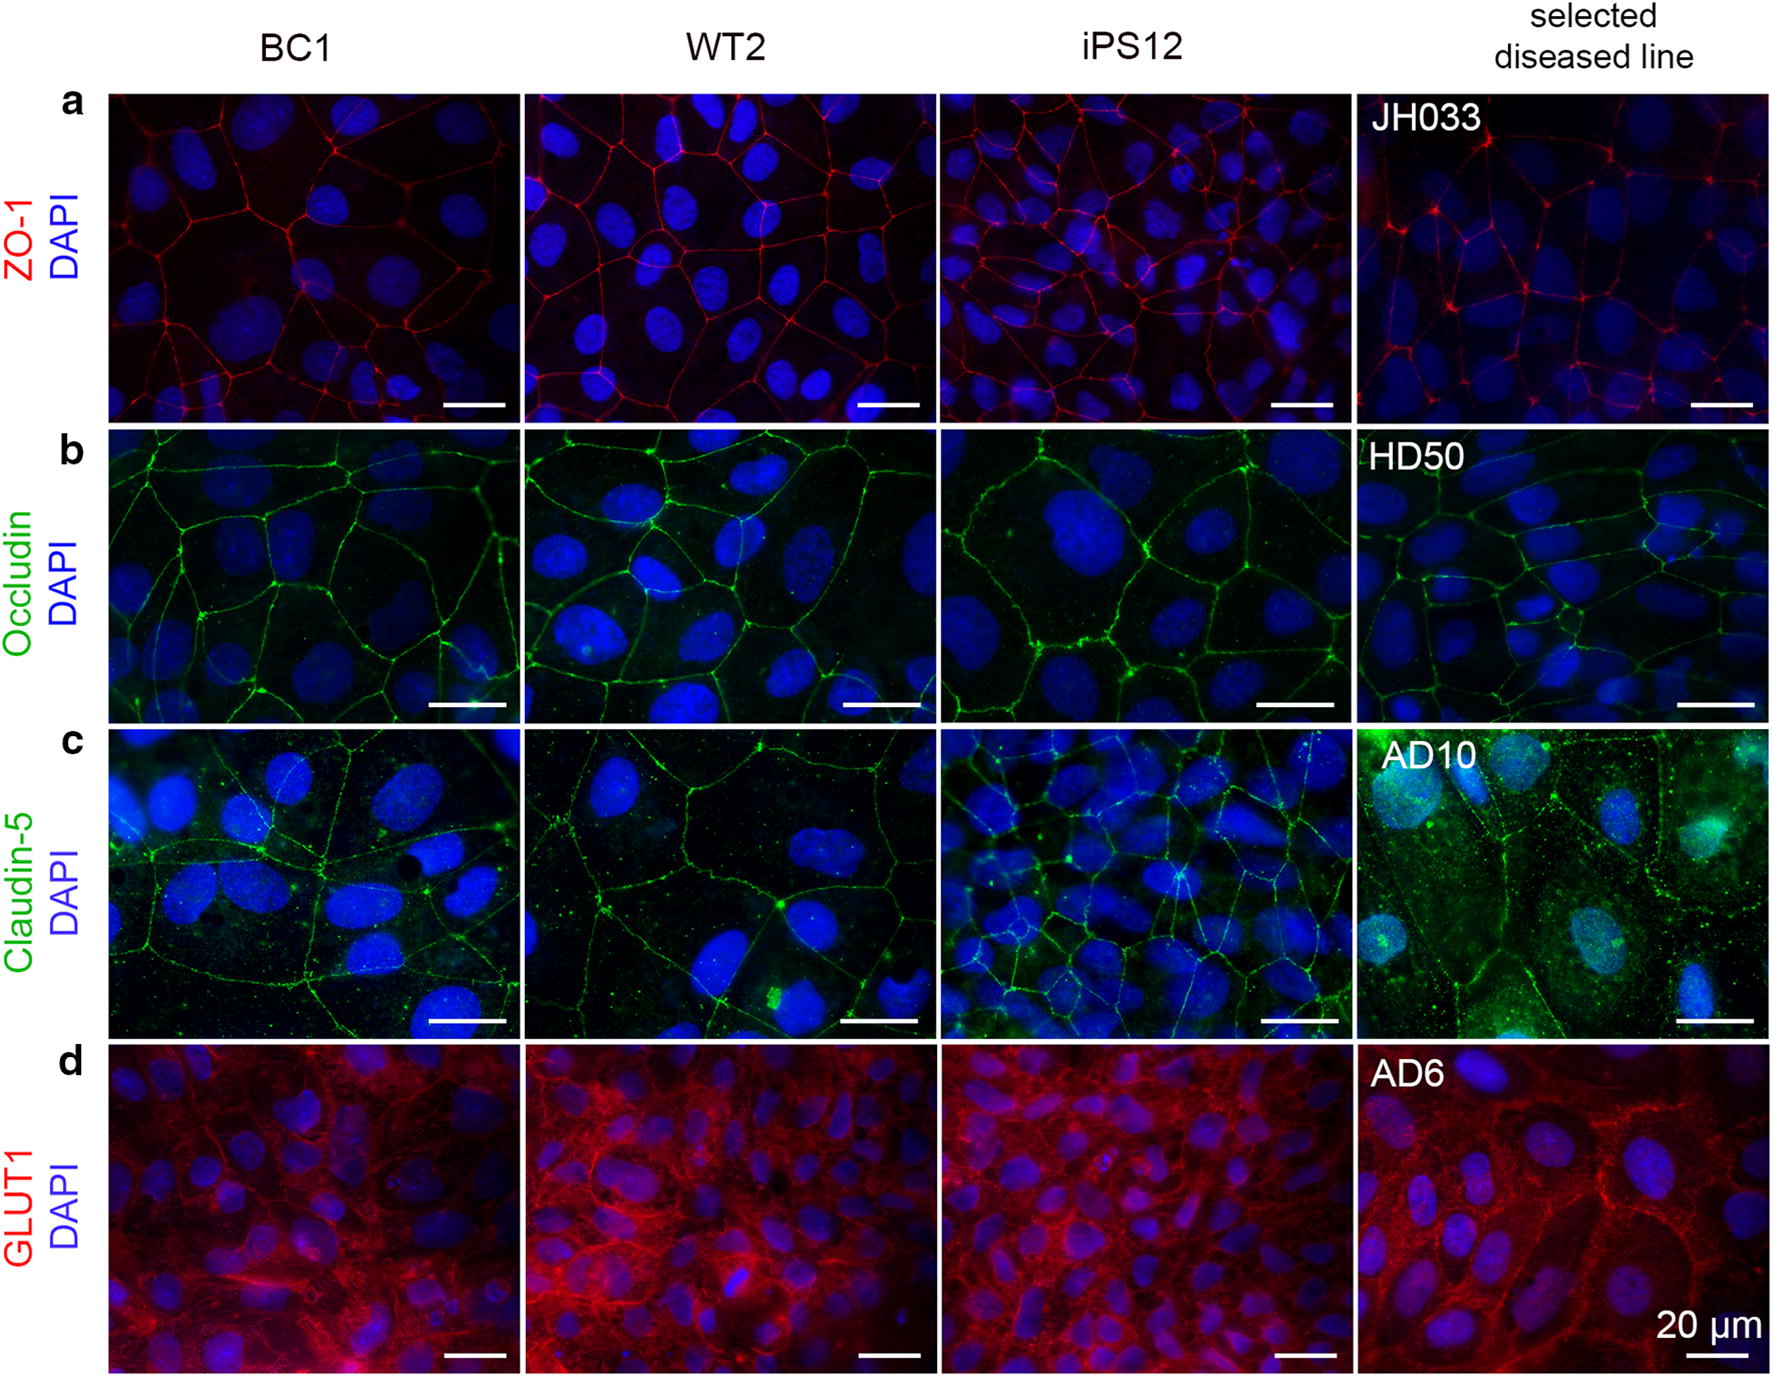
Protein localization in dhBMEC monolayers derived from healthy individuals and individuals with NDD. The first column show images from the healthy controls WT2. The last column shows images from a selected NDD hBMEC line highlighting changes in protein localization if any were evident. The rows correspond to: a ZO-1, b occludin, c claudin-5, and d the GLUT1 transporter. The tight junction markers were localized at junctions in all cell lines. The GLUT1 transporter showed blanket staining over the cell membrane for all monolayers. Additional stains can be found in Additional file 1: Figures S6–S9