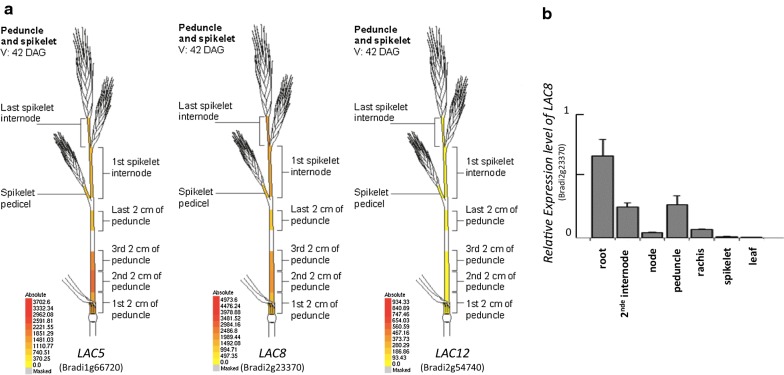
Fig. 1.
Expression levels of LAC5, LAC8 and LAC12. a In silico expression levels of the three laccases obtained with the Gene Atlas tool from BAR Brachypodium eFP Browser (http://bar.utoronto.ca/efp_brachypodium/cgi-bin/efpWeb.cgi) [18]. b qPCR analysis shows the relative expression levels of LACCASE8 transcript in different tissues

