Figure 6.
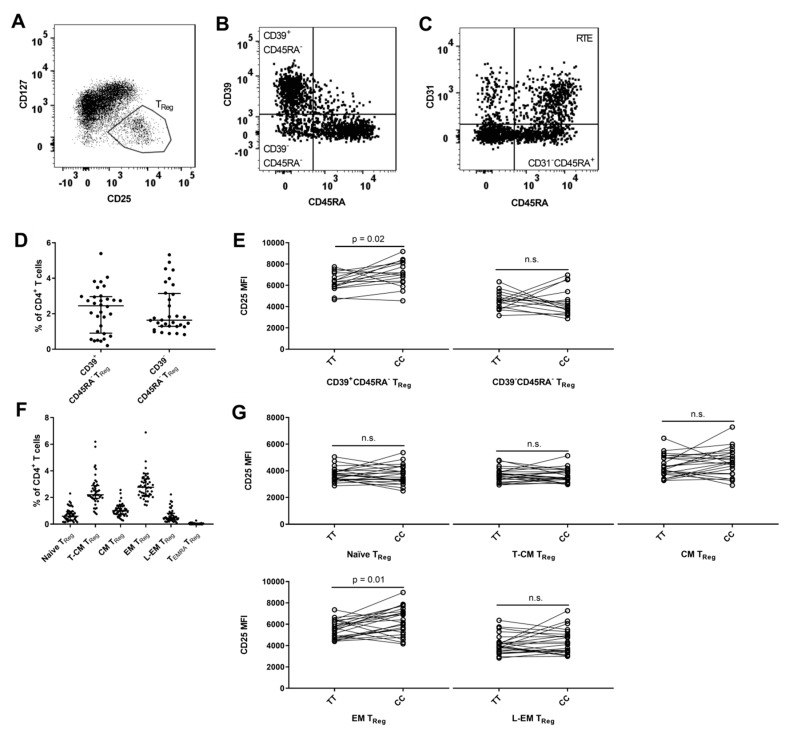
IL2RA genotype associations on CD4+ TReg subsets. (A) Gating of TReg cells, defined by being CD127loCD25hi. (B) TReg cells are gated by expression of CD39 and CD45RA in two subsets: CD39+CD45RA− (committed TReg cells) and CD39−CD45RA−. (C) TReg cells are gated by expression of CD31 and CD45RA in two subsets: Recent thymic emigrants (RTE; CD31+CD45RA+) and CD31−CD45RA+. (D) Frequency of CD39+CD45RA− and CD39−CD45RA− TReg in relation to CD4+ T cells. (E) Homozygous carriers of both MS-associated IL2RA SNPs rs2104286 and rs11256593 are defined by TT for the risk genotype and CC for the protective genotype. Differences between carriers of the risk genotype TT (N = 16) and carriers of the protective genotype CC (N = 16) on surface expression of CD25 (MFI) on CD39+CD45RA− (Paired t test, mean of difference = 800.9; 95% CI = 175.2 to 1427) and CD39−CD45RA− TReg (Paired t test, mean of difference = −110; 95% CI = −956.9 to 736.9) cells. (F) Frequency of naïve (CD45RAhiCCR7+), transitional central memory (T-CM) (CD45RAlo-intCCR7+), central memory (CM) (CD45RA−CCR7+), effector memory (EM) (CD45RA−CCR7−), late effector memory (L-EM) (CD45RAlo-intCCR7+) and TEMRA (CD45RAhiCCR7−) cells with a TReg phenotype in relation to CD4+ T cells. Gating for CD4+ T cell differentiation are outlined in Figure 1B. (G) Differences between TT carriers (N = 23) and CC carriers (N = 23) on surface expression (MFI) of CD25 on TReg naïve (Paired t test, mean of difference = −25.9; 95% CI = −303.2 to 251.4), T-CM (Paired t test, mean of difference = −33; 95% CI = −262.1 to 196.1), CM (Paired t test, mean of difference = 278.1; 95% CI = −149.7 to 706), EM (Paired t test, mean of difference = 720.6; 95% CI = 181.5 to 1260) and L-EM (Paired t test, mean of difference = 240.6; 95% CI = −222.3 to 703.5) cells.

