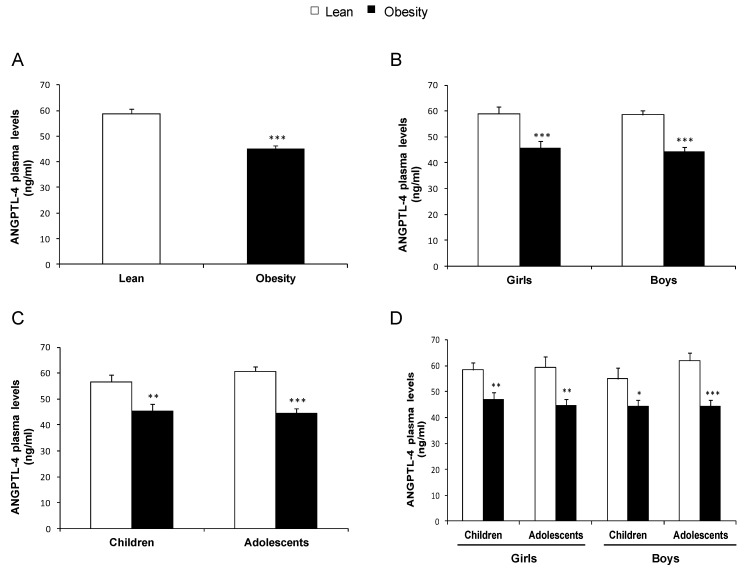
Figure 1.
ANGPTL-4 circulating levels of the cross-sectional study population: (A) ANGPTL-4 concentration in individuals with normal weight and obesity; (B) ANGPTL-4 levels according to gender; (C) ANGPTL-4 concentration according to the pubertal stage; and (D) ANGPTL-4 levels according to gender and pubertal stage. Data are expressed as mean ± SEM. * p < 0.05, ** p < 0.01, *** p < 0.001.

