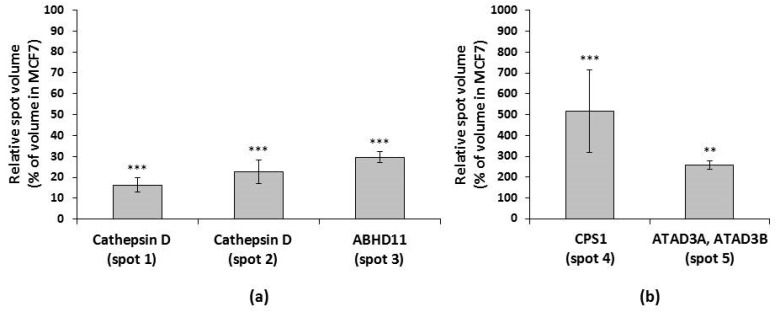
Figure 3.
Expression levels of the identified proteins, (a) downregulated and (b) upregulated, in paclitaxel-resistant MCF7/PacR cells is presented as a percentage of the level in paclitaxel-sensitive MCF7 cells. Each column represents the mean value of the expression level ± SEM of the corresponding spots from three independent sets of gels. ** p < 0.01, *** p < 0.001 when compared with the level in MCF7 cells.

