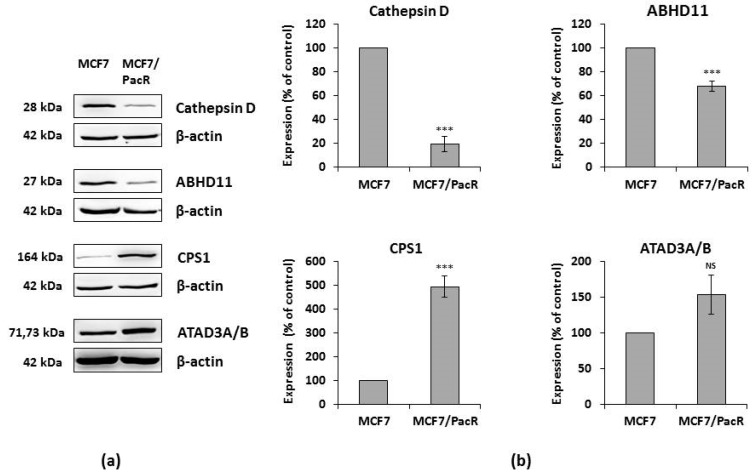
Figure 4.
Confirmation of changes in protein expression detected by 2D analysis employing western blot analysis. (a) Western blot was performed with whole-cell lysates of paclitaxel-sensitive MCF7 cells and paclitaxel-resistant MCF7/PacR cells. Levels of tested proteins were assessed using western blot analysis employing relevant antibodies (see Section 4). β-actin served as a loading control. Representative results are from three independent experiments. (b) Densitometric analysis of western blots normalized to β-actin level. The expression of proteins in MCF7/PacR was compared to the expression in MCF cells (100%), and relative values were normalized to β-actin levels. Columns represent mean values of band volume ± SEM from three experimental values. *** p < 0.001 compared to the volume in MCF7 cells. NS = statistically non-significant difference.

