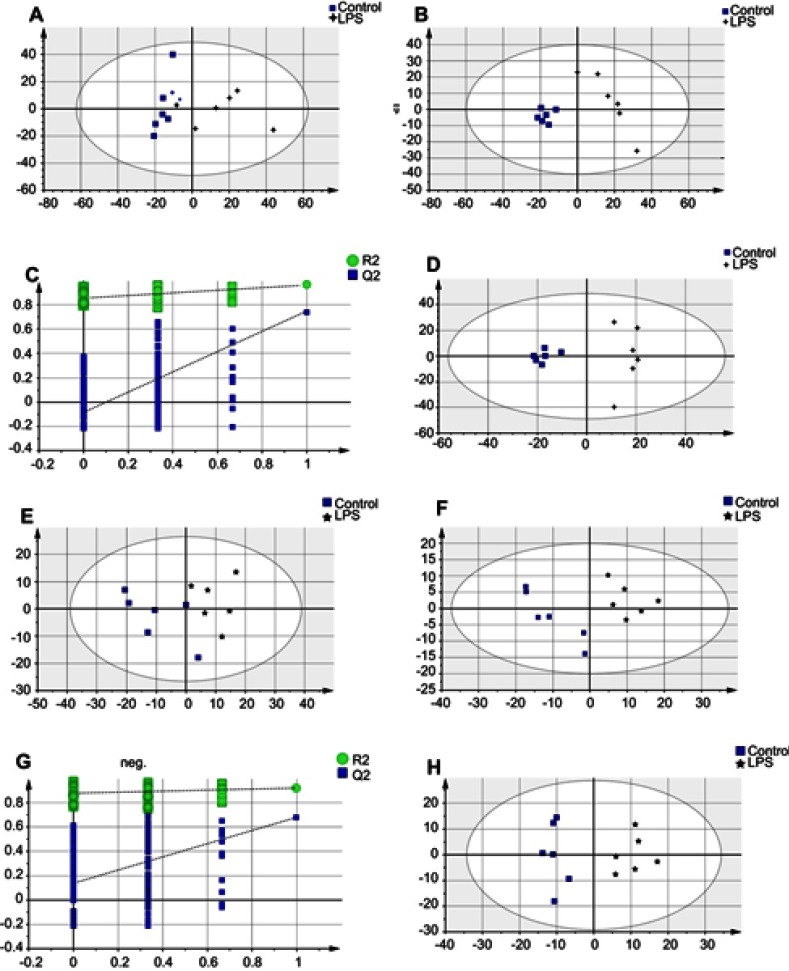
Figure 2.
Multivariate statistical analysis between the LPS-induced depression and healthy Control groups at ESI+: (A) principal component analysis (PCA) scores plot; (B) partial least squares-discriminate analysis (PLS-DA) scores plot; (C) statistical validation of the PLS-DA model through 200× permutation testing; and (D) pair-wise orthogonal projections to latent structures discriminant (OPLS-DA) scores plot. Multivariate statistical analysis between the LPS-induced depression and healthy Control groups at ESI−: (E) PCA scores plot; (F) PLS-DA scores plot; (G) statistical validation of the PLS-DA model through 200×permutation testing; and (H) OPLS-DA scores plot.
Abbreviations: LPS, lipopolysaccharide; ESI, electrospray ionization.

