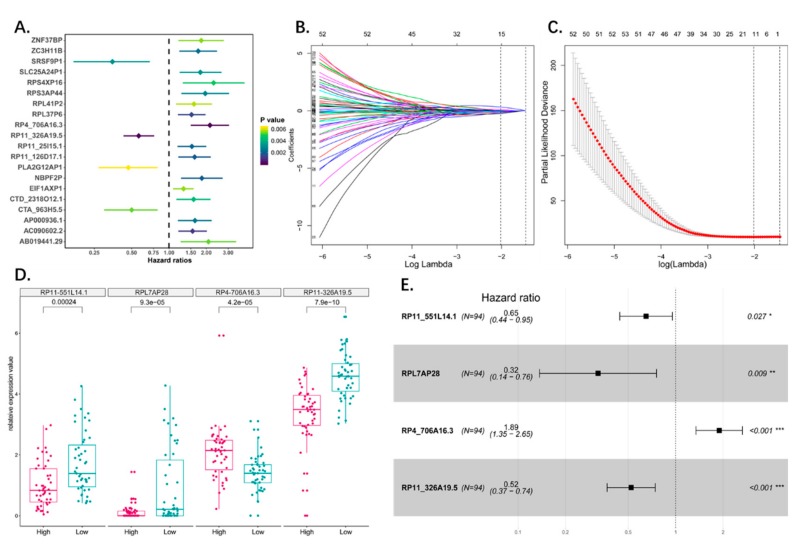
Figure 2.
(A) The forest plot showed the top 20 (20/125) significant survival related pseudogenes through univariate cox analysis. (B) LASSO coefficient profiles of the survival related pseudogenes. A coefficient profile plot was produced against the log lambda sequence. Vertical line was drawn at the value selected using 10-fold cross-validation, where optimal lambda resulted in 15 nonzero coefficients. (C) Tuning parameter (lambda) selection in the LASSO model used 10-fold cross-validation via minimum criteria. Dotted vertical lines were drawn at the optimal values by using the minimum criteria and the 1 standard error of the minimum criteria (the 1-SE criteria). A lambda value of 0.13 was chosen (lambda.min) according to 10-fold cross-validation. (D) Boxplot showed the expression status of the four pseudogenes between high risk and low risk group which divided by median risk score. (E) Forest plot showed results of multivariate cox analysis. Four significant pseudogenes in multivariate cox analysis were screened out (p-value < 0.05) as candidate to construct the risk model.

