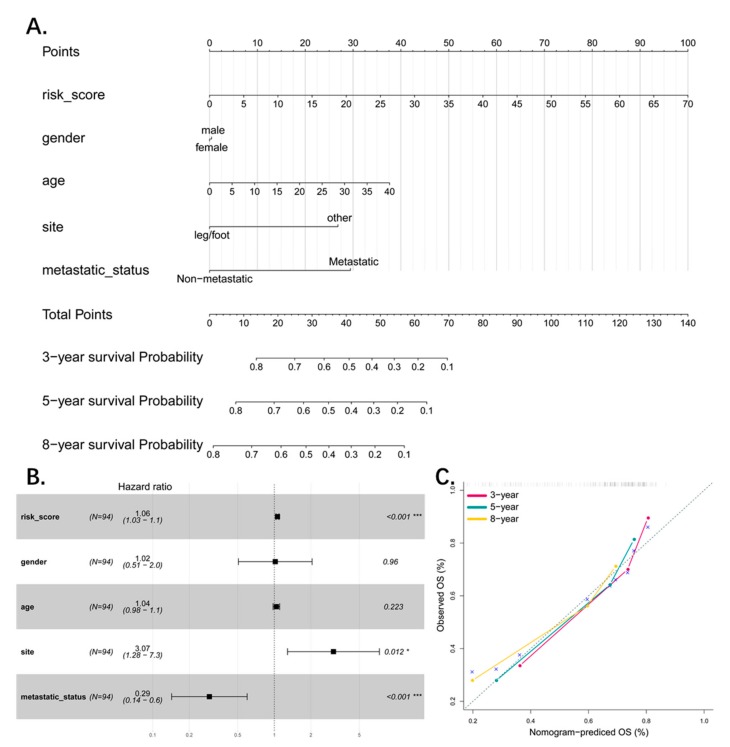
Figure 6.
(A) Nomograms combining 4-pseudogene signature and clinical information to predict 3-, 5-, and 8-year survival probability of patients. (B) Forest plot showed results of multivariate cox analysis with 4-pseudogene signature and clinical information. The 4-pseudogene signature is an independent factor (p-value < 0.001). (C) The calibration of each model in terms of agreement between predicted and observed 3-, 5-, or 8-year outcomes. Model performance is shown by the plot, which is highly relative to the 45-degree line, representing perfect prediction.

