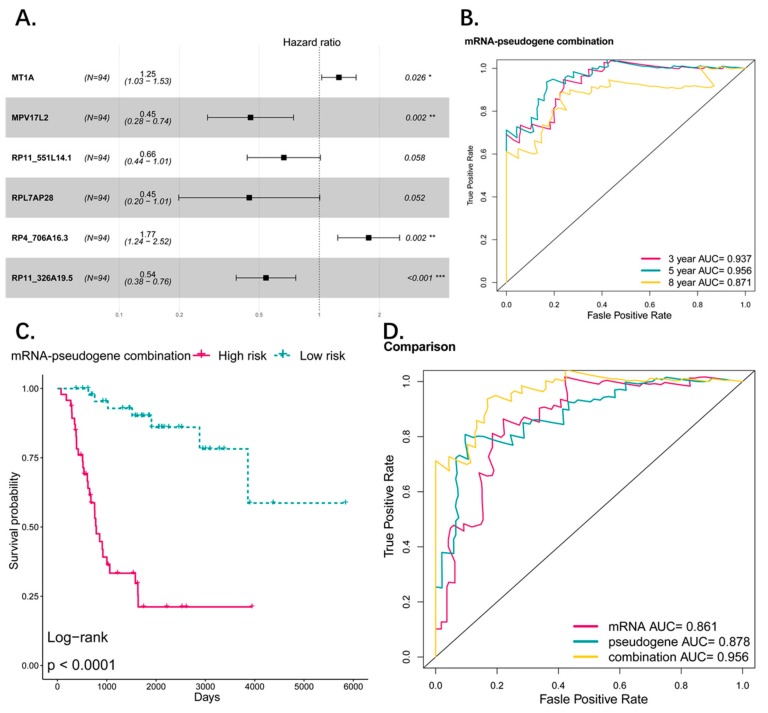
Figure 9.
(A) Forest plot showed results of multivariate cox analysis for the combination model of genes and pseudogenes. (B) ROC analysis of sensitivity and specificity for the combination signature in predicting the OS of patients for 3, 5, and 8 years. (C) The Kaplan–Meier estimates of the OS for high-risk and low-risk patient cohorts grouping by the combination signature (N = 94). The OS differences between the two groups were determined by the two-sided log-rank test. It can be concluded that higher risk scores are significantly associated with worse OS (p < 0.0001). (D) ROC analysis of sensitivity and specificity for the comparison among the two-gene signature, four-pseudogene signature, and combination signature in predicting the OS of patients for 5 years and combination signature performed better than the other two.

