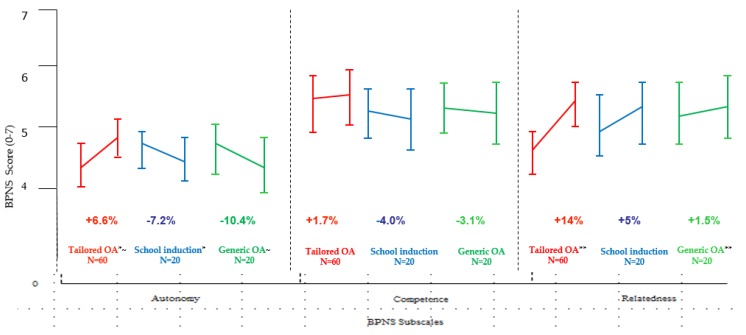
Figure 2.
Baseline and follow-up mean difference scores on Basic Needs Satisfaction in Life Scale (BPNS) for Autonomy, Competence and Relatedness by programme. BPNS 0-7 (low-high) standardised scale for each subscale mean score; Independent t tests * Tailored OA v School induction t(78) = 3.04, p = 0.05; ~Tailored OA v Generic OA t(78) = 3.42, p = 0.05; ** Tailored OA v Generic OA t (78) = 2.84, p = 0.05; Lines depict standard deviation.

