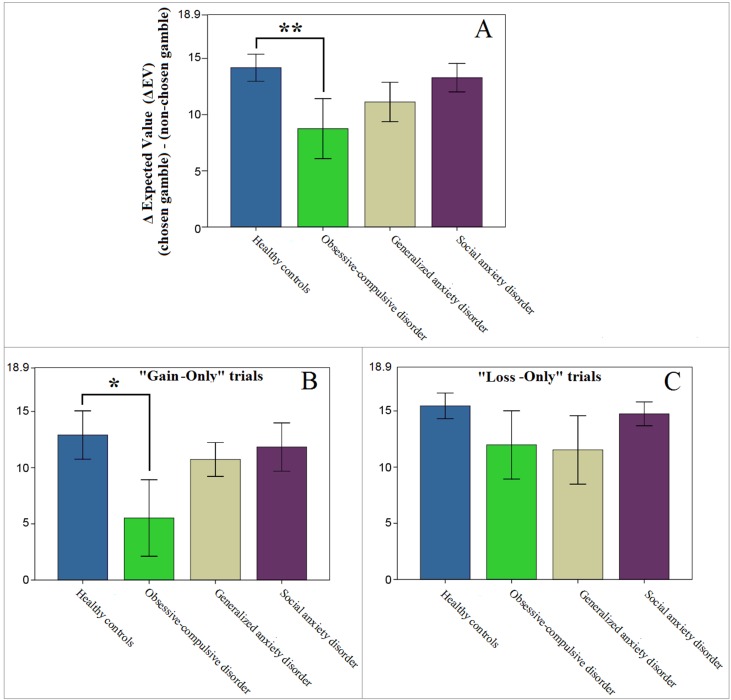
Figure 4.
Performance on “Gain-Only” and “Loss-Only” trials where both gambles had identical probabilities (14 out of 126 trials). Higher values represent more optimal performance with potentially better outcomes. Note that the maximum value on the y-axes (18.9) represents the optimal difference in expected value (ΔEV), if the gamble with the higher EV was always chosen. (A) Patients diagnosed with obsessive-compulsive disorder (OCD) showed less optimal performance than controls (**p = .041). (B, C) This result appeared to be mostly driven by differences on “Gain-Only” trials (*p = .067, whereas p = .306 for the OCD vs HC comparison on “Loss-Only” trials). Error bars indicate ±1 standard error of the mean.

