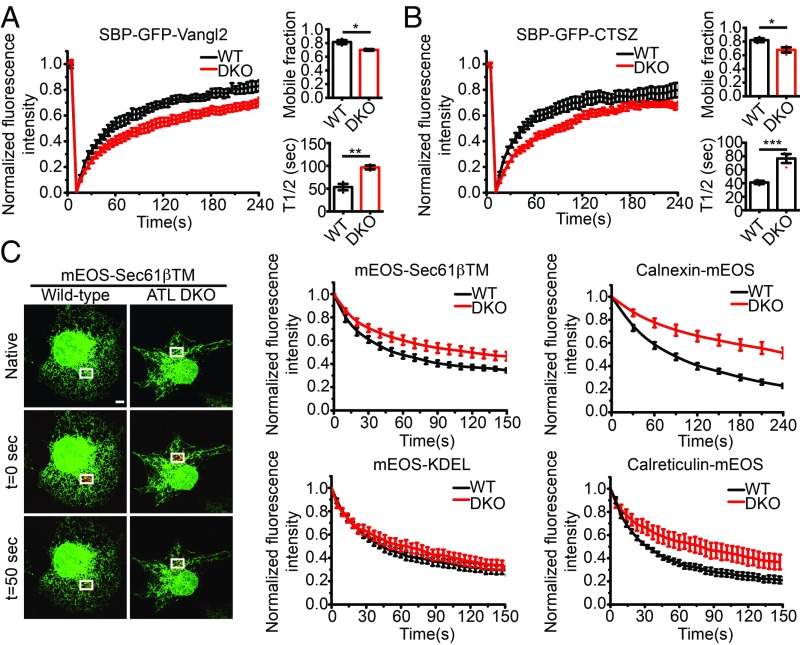
Fig. 5.
Reduced protein mobility in the ER of ATL-deleted cells. (A and B) FRAP in the ER of wild-type and ATL DKO cells expressing RUSH cargo proteins. Cells were transfected with SBP-GFP-Vangl2 in A or SBP-GFP-CTSZ in B for 18 h. FRAP was performed immediately after biotin addition. Recovery curves (mean ± SEM), mobile fractions, and average recovery halftime (T1/2) were derived from FRAP experiments. n = 3, ≥ 14 cells per group; bars are presented as mean ± SEM; *P < 0.05, **P < 0.01, ***P < 0.001 by 2-tailed Student’s t test. (C) FLAP in the ER of wild-type and ATL DKO cells expressing ER-targeted photoswitchable (green to red) fluorescent reporters. ER membrane protein reporters include mEOS-Sec61βTM and calnexin-mEOS. ER luminal protein reporters include calreticulin-mEOS and mEOS-KDEL. Taking mEOS-Sec61βTM as an example, reporter was photoswitched in a small area (white rectangle) next to the nucleus, after which the switched fluorophores diffused to other regions of the ER. The frame just before photoswitching is indicated as native, and the frame immediately following photoswitching as t = 0 s. The fluorescence loss over time was measured for the photoswitched region. The initial fluorescence intensity was set to 1. The curves show the mean fluorescence intensity ± SEM. n > 3, ≥ 16 cells per group (Scale bar, 5 μm).

