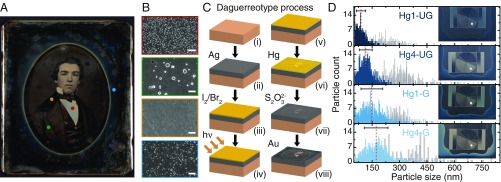
Fig. 1.
Daguerreotype characteristics. (A) Daguerreotype in the study collection of The Metropolitan Museum of Art (artist unknown, ca. 1850s). The perimeter has a blue gradient created by an oval mask applied during sensitizing and mercury development. (B) Scanning electron microscope (SEM) images, outlined in colors corresponding to colored circles in A, show varying nanoparticle densities, from Top to Bottom, in highlight, midtone, shadow, and blue-tinted regions of the image. (Scale bars, m.) (C, i–viii) Schematic outlining the steps of the daguerreotype process. (D) Particle size counts, averages (red dashed line), and SD (black bar) for daguerreotype samples (Insets). Hg1 and Hg4 refer to minutes of mercury exposure, and UG and G refer to ungilded and gilded plates, respectively. Blue lines represent blue mask regions, while gray lines correspond to the regions of highest light exposure (i.e., highest particle density) of the exposure step wheels, marked by gray circles in Insets.

