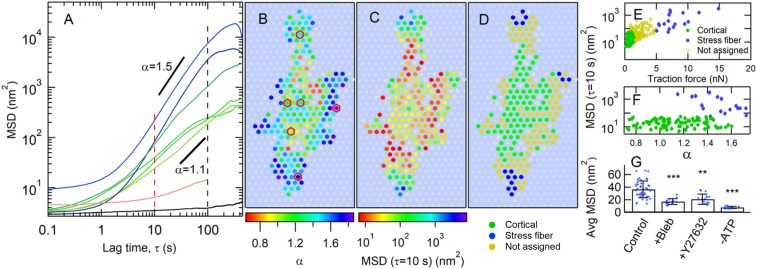
Fig. 2.
Cell fluctuations show spatial variation of amplitude and superdiffusive exponent. (A) MSD vs. lag time τ for individual microposts typically show superdiffusive behavior (∼τα, with α > 1). Red and black dashed lines show τ ranges discussed below. The black trace is the MSD for a post not coupled to a cell, and the red trace shows the background due to fluctuations in cellular optical density (SI Appendix). (B and C) Heat maps of (B), MSD exponent α (for 5 s ≤ τ ≤ 10 s), and (C), MSD amplitude at τ = 10 s for cell-adhered posts. Gray hexagons show posts not engaged with the cell for the full measurement interval. Gray circles indicate background posts. Posts with MSD traces in A are outlined in red in B. (D) Classification of microposts according to traction force: maximum traction force of <2 nN (“cortical” posts with low traction force) in green; average traction force of >5 nN (“stress fiber” posts with high traction force) in blue; remainder of posts in yellow. (E) Scatter plot of MSD magnitude at τ = 10 s vs. average traction force. (F) MSD magnitude at τ = 10 s vs. MSD exponent α for cortical and stress fiber posts (omitting middle case open circles in E). SEs for points in E and F are smaller than the symbol sizes. (G) Myosin inhibition reduces displacement fluctuations in cortical posts. Error bars in G show ±SD. Average MSD magnitude at τ = 10 s for control cells (25 cells), and for cells following treatment with blebbistatin (10 cells), Y27632 (11 cells), or ATP depletion (4 cells); significance via unpaired t test. **P < 0.01; ***P < 0.001.

