Fig. 4.
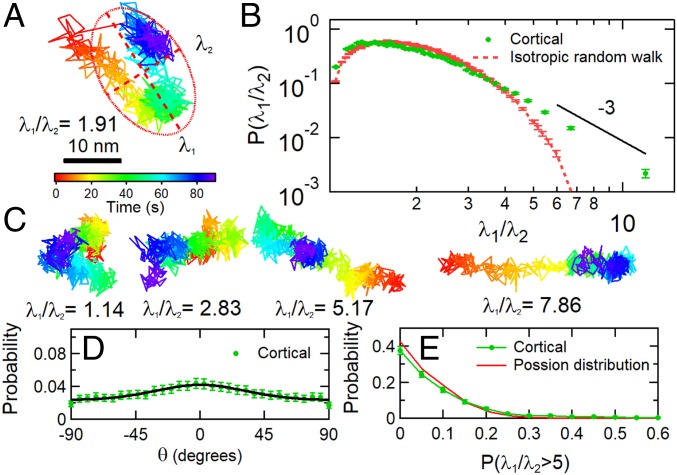
Cortical cell fluctuations showed anisotropy. (A) An example of a displacement trajectory of a micropost over a 90-s interval. The red ellipse with semimajor axis λ1 and semiminor axis λ2 illustrates the computation of the anisotropy index λ1/λ2 for this trajectory via principal component analysis (λ1/λ2 = 1.91 in this case.). (B) Probability distribution of the anisotropy index λ1/λ2. Eyeguide highlights a power law tail for highly anisotropic trajectories. (C) Examples of posts with a range of λ1/λ2. (D) Probability distribution of the angle between the major axis of the fitted ellipse’s long axis and the direction of the micropost’s average traction force F. The solid line is a fit with full width 2σ = 107°. See SI Appendix, Methods for details. (E) Probability distribution of the fraction of a post’s fluctuations with λ1/λ2 > 5, measured over 1,800 s in 90-s intervals. Error bars were estimated as for each bin in the probability distributions.

