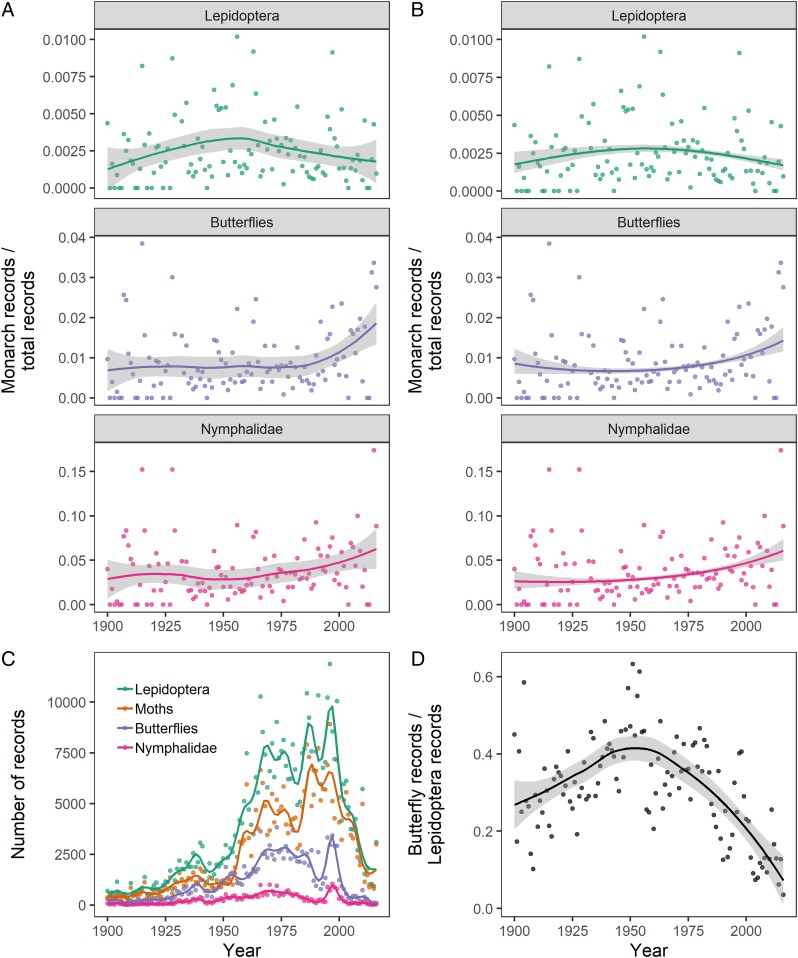
Fig. 1.
Trends in museum records of the eastern population of North American monarch butterfly change with the choice of standardization. All data came from ref. 8 and span the eastern United States from 1900 to 2016. (A) I reproduce figure 1A of ref. 3 with Boyle et al.’s standardization by Lepidoptera records (Top) and present 2 alternative standardizations (Rhopalocera and Nymphalidae) (Middle and Bottom). I similarly use the default LOESS smooth in the ggplot2 R package (9) for visualizing trends and 95% CIs. (B) The relative abundance of the 3 standardizations are alternatively modeled with a binomial generalized linear model, weighted by the annual number of records, predicting relative abundance with linear and quadratic year covariates. (C) Total number of records of Lepidoptera, moths, butterflies, and Nymphalidae each year with splines showing trends. (D) The proportion of butterfly records to all Lepidoptera records shows a strong temporal trend that influences the mid-20th-century peak of monarch abundance reported in ref. 3 and shown in A, Top and B, Top.

