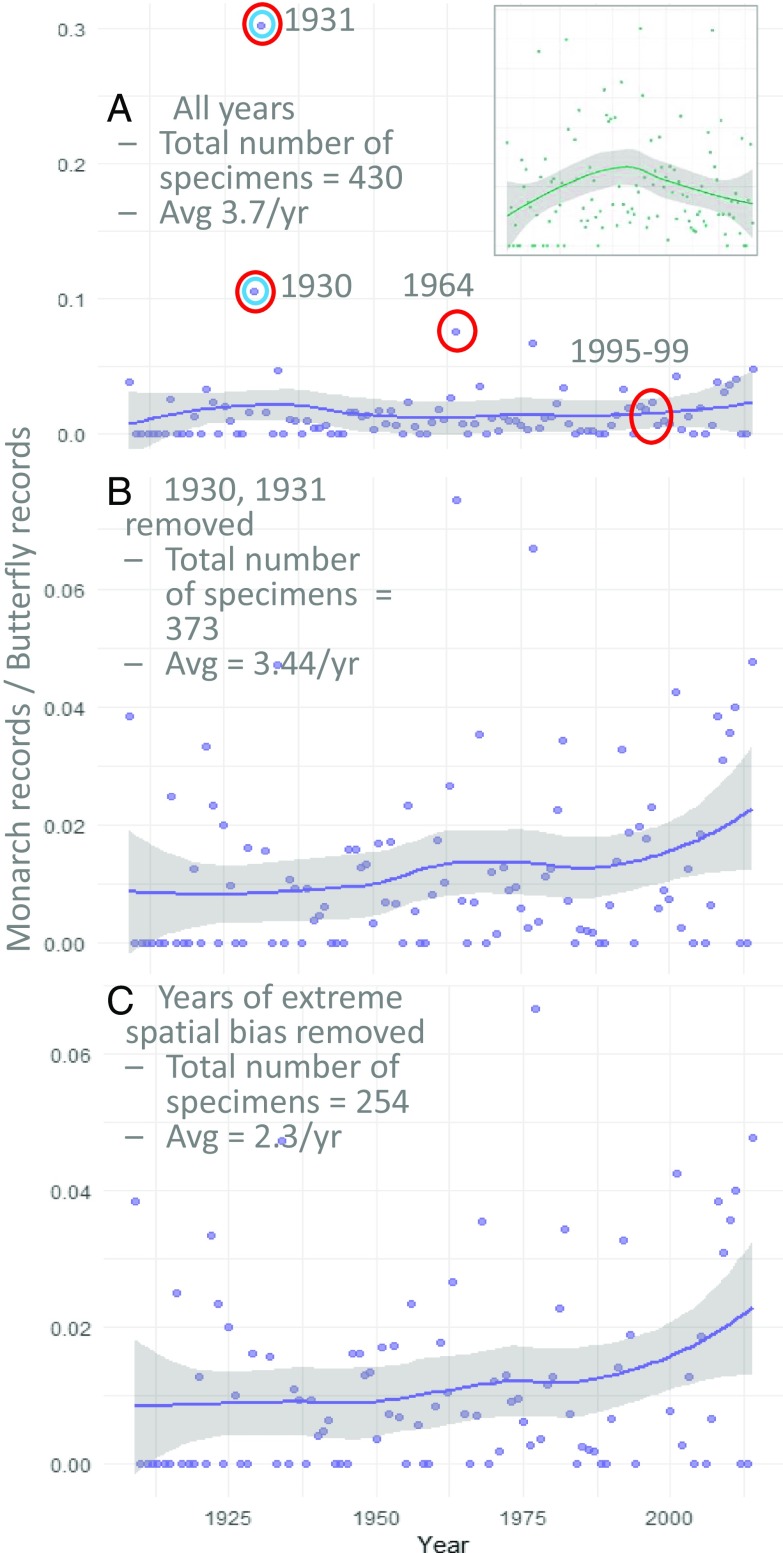
Fig. 2.
A yearly monarch abundance index was calculated using a subset (see text) of the data and R script provided by Boyle et al. (6). The original, reported pattern is shown in A, Inset (reprinted from ref. 7). We restricted our analyses to primary monarch breeding grounds (green outline in Fig. 1) during the peak breeding season (June 15 to August 14). We present results when all years (1900 to 2016) were included (A) and when 2 outlier years (identified with blue circles in A) were excluded (B) as was done in Boyle et al. (6). We also present results when all outlier years (identified with red circles in A) were excluded (C). The total number of monarchs included in each analysis and the mean number per year is shown in A–C. The median number of monarch specimens collected per year in all panels is 1.

