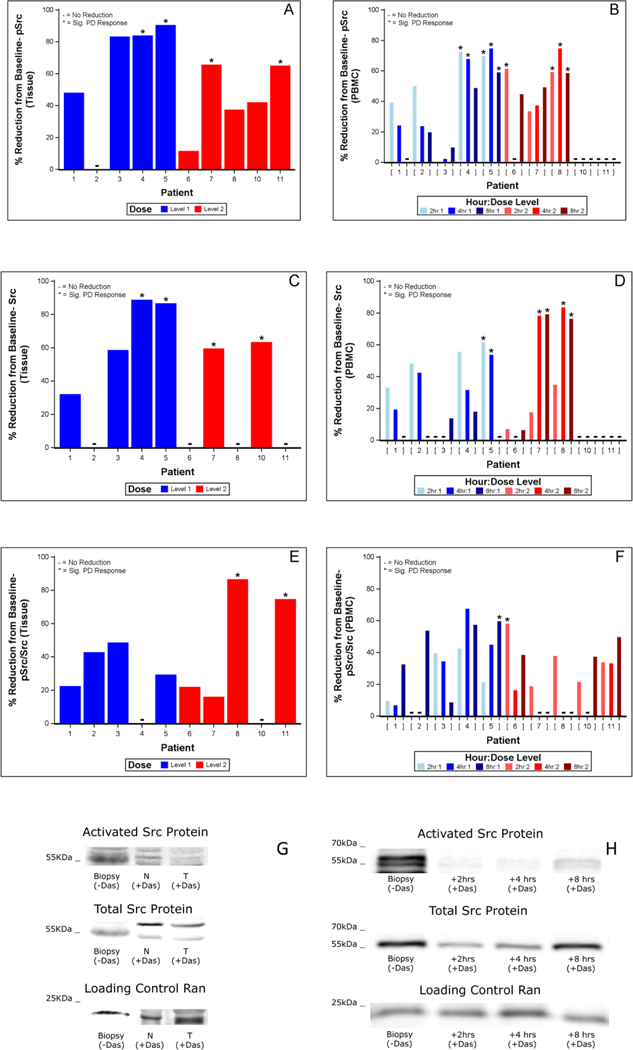
Figure 2.

Reduction of Src activity and protein levels following dasatinib treatment.
Figure 2A. Percent reduction from baseline biopsy of pTyr419Src activity (pSrc) in tumor (T) and adjacent normal tissue (N) following 8 hr dasatinib treatment. Values were derived from 3–4 replicates per sample measured in densitometry units (DU) from immunoblots of pSrc relative to Ran loading control. Dose Level 1: blue; Dose Level 2: red. * denotes PD-level response values; +: no reduction. Results are from individual patients, who are identified by unique patient number.
Figure 2B. Percent reduction from baseline of PBMC pSrc. Blood samples from time of biopsy (baseline) as well as 2, 4, and 8 hr after dasatinib treatment were analyzed per patient as in Fig. 2A.
Figure 2C. Percent reduction of total Src protein levels following dasatinib treatment in N and T tissue relative to Src protein levels from baseline biopsy.
Figure 2D. Percent reduction of total Src protein levels following dasatinib treatmen in PBMC relative to Src protein levels from baseline.
Figure 2E. Percent reduction of pSrc/Src following dasatinib treatment in N and T tissue relative to pSrc/Src from baseline biopsy.
Figure 2F. Percent reduction of pSrc/Src following dasatinib treatment. in PBMC relative to pSrc/Src from baseline.
Figure 2G. Representative immunoblot of patient 5 tissue showing pSrc, Src protein and Ran levels in T and N tissue following dasatinib treatment relative to pre-dasatinib biopsy.
Figure 2H. Representative immunoblot of patient 5 PBMC showing pSrc, Src protein and Ran levels in biopsy and 2, 4 and 8 hr following dasatinib treatment.
