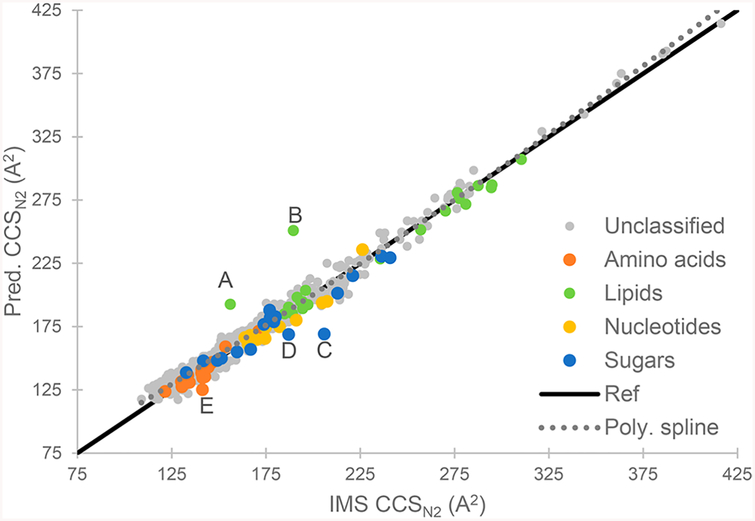
Figure 5.
Comparison of IMS measured and predicted CCS values for all compound from the testing set. Compound classes are from the Baker data set, others are unclassified. The solid line (ref) represents a reference line of perfect fit (a slope of 1). The dotted line indicates a 2nd-order polynomial spline fit to the data to show overall tendency. Letters A–E indicate outliers, respectively, methyl behenate, 1,2-diacyl-sn-glycero 3-phosphocholine, d-maltose, sophorose, and l-threonine (see the Supporting Information).

