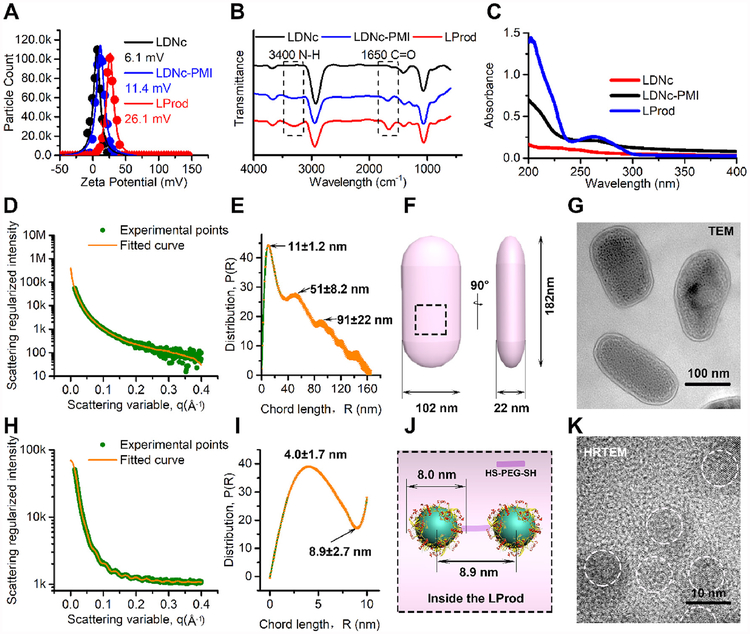
Fig. 2. Characterization of LProd.
(A) The surface charge (Zeta potential) of LDNc, LDNc-PMI and LProd measured in PBS buffer (pH 7.4) by DLS at 37 °C. All data points were the average of 20 measurements and were fitted by to a Gaussian distribution. (B) FT-IR spectroscopy of LDNc, LDNc-PMI and LProd. (C) UV-vis absorption spectra of LDNc, LDNc-PMI and LProd. (D) Small angle X-ray scattering (SAXS) diffractograms of LProd measured at the concentration of 0.1 mg/mL in PBS. The orange line is the least squares fit to the data (green points) using a rod model. (E) Corresponding chord length distributions calculated from (D). P (r) = chord length distribution function; R = radius. (F) The schematic illustration of nanobacteria-like LProd size, which was obtained from (E). (G) TEM image of LProd taken at 100 kV. (H) SAXS diffractograms of 1 mg/mL LProd in PBS. The orange line is the least squares fit to the data (green points) using a sphere model. (I) Corresponding chord length distributions calculated from (H). (J) Internal morphology of LProd obtained from (I). (K) High-resolution TEM (HRTEM) image of LProd taken at 300 kV. (For interpretation of the references to color in this figure legend, the reader is referred to the Web version of this article.)

