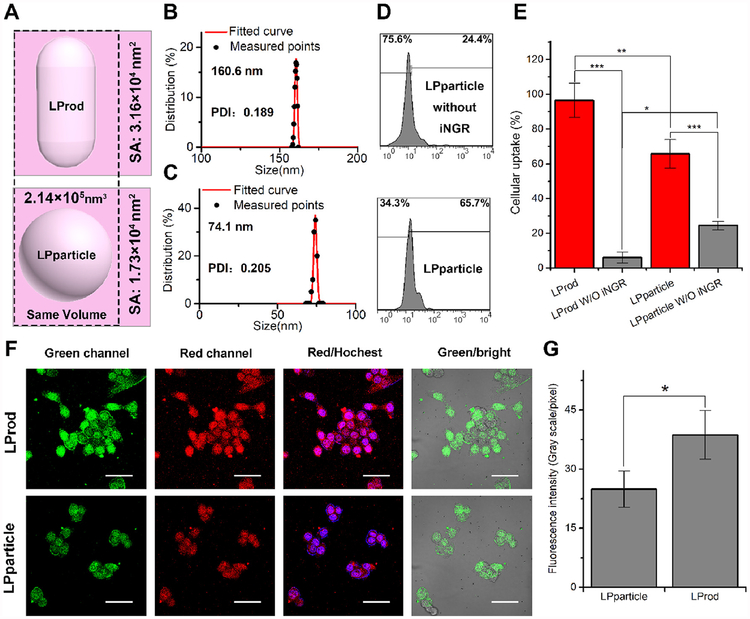
Fig. 5. Cellular internalization of LProd and its spherical counterparts.
(A) Schematic depiction of the morphology of LProd and LPparticle. Distributions of hydrodynamic diameter of LProd (B) and LPparticle (C) measured by DLS. (D) Cellular uptake of LPparticle in vitro measured by flow Cytometer. (E) Statistical analysis of cellular uptake rate of LProd, LProd without iNGR, LPparticle, and LPparticle without iNGR. (F) Cellular uptake analysis of LProd in HCT116 cells by confocal laser scanning microscope (CLSM). CLSM images of HCT116 cells after a 6-h incubation with 200 nM LProd or LPparticle. All images were taken under the same exciting light and detector gain (scale bar: 60 μm). (G) Semi-quantitating the unit fluorescence intensity of LProd- and LPparticle-treated HCT116 cells in (F).

