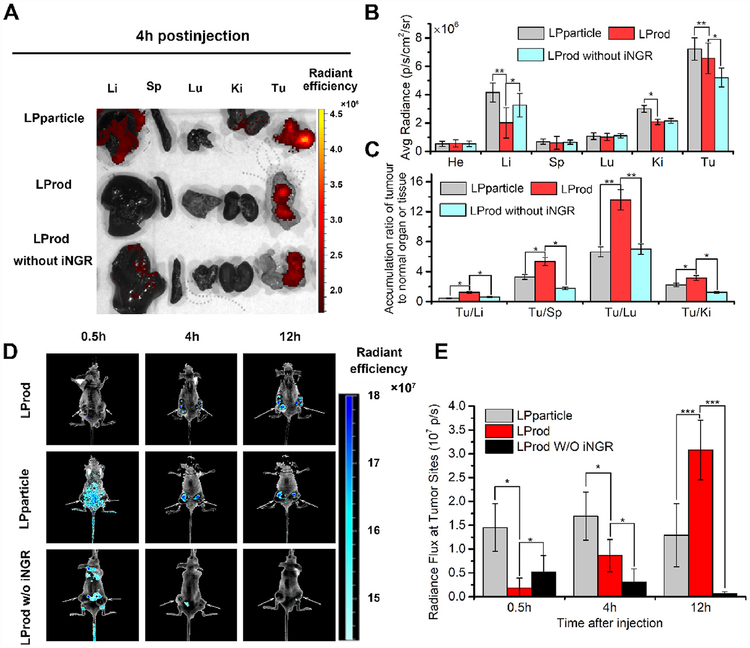
Fig. 6. Enhanced in vivo tumor imaging of LProd.
(A) Representative ex vivo fluorescent image of major organs and tumor sites at 4 h after intravenous injection of Lprod, LPparticle, or LProd without iNGR in HCT116 tumor-bearing mice (dose: 100 μg of per mouse). Li, liver; Sp, spleen; Lu, lung; Ki, kidneys; Tu, tumor. (B) Region-of-interest (ROI) analysis of the ex vivo fluorescent data as shown in (A). (n = 3/group, mean ± s.d.). Average accumulation of Lprod, LPparticle, and LProd without iNGR in heart (He), liver (Li), splees (Sp), lung (Lu), kidney (Ki) and tumor (Tu) at 4 h post-injection. (C) Tumor-to-background (normal organ or tissue) ratios for LPparticle, LProd and LProd without iNGR at 4 h post-injection. LProd showed improved tumor selectivity over the surrounding normal organs or tissues, compared to LPparticle or LProd without iNGR. (D) Fluorescence images of LProd, LPparticle and LProd w/o iNGR in vivo. Fluorescence images of LProd, LPparticle and LProd w/o iNGR were obtained 0.5, 4, and 12 h after intravenous injection. The arrows indicate tumor sites. All images were acquired under the same conditions (power density ≈ 200 mW cm−2). (E) Fluorescent analysis of tumor sites in the LProd-, LProd w/o iNGR- and LPparticle-treated mice at 30 min, 2 h and 12 h after intraperitoneal injection (n = 3/group, mean ± s.d.). P values were calculated by t-test (*, p < 0.05; **, p < 0.01; ***, p < 0.001).

